Fishbone Analysis Diagram Layout Template for PowerPoint & Google Slides


Product Description
Description
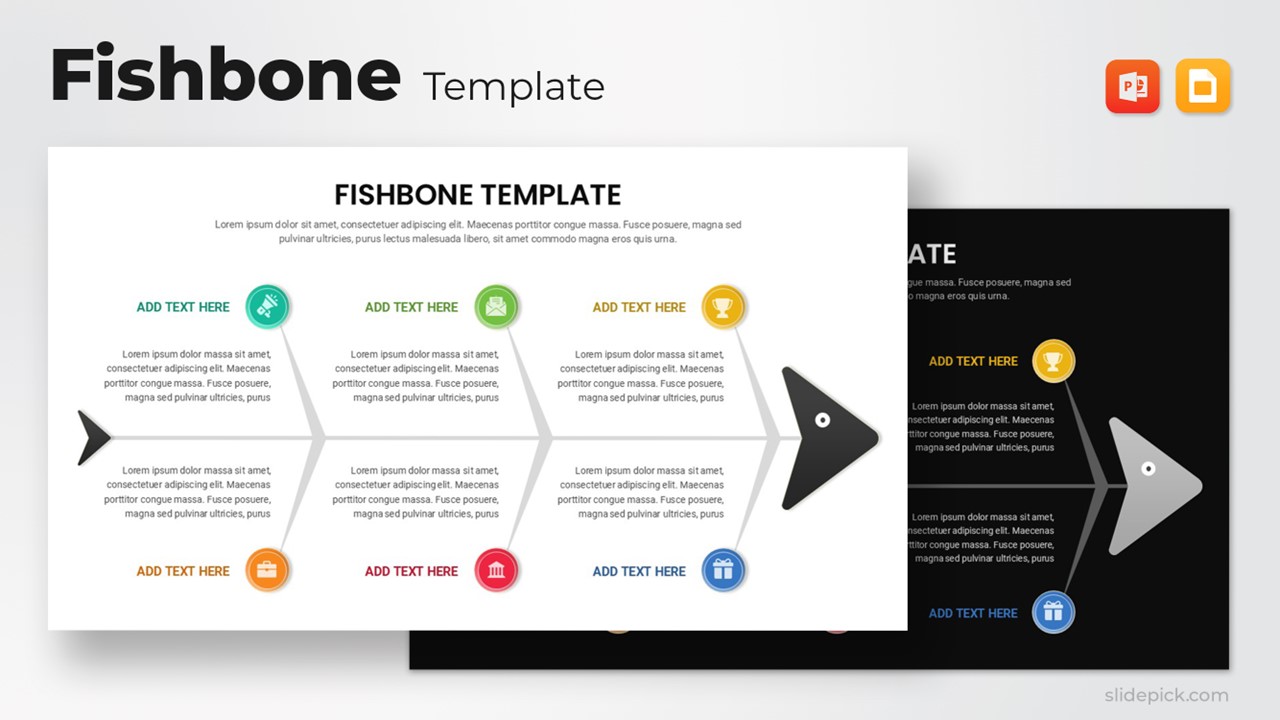
This Fishbone Analysis Diagram template offers a clear and structured framework for teams aiming to identify, categorize, and address root causes within any workflow or problem-solving environment. Designed with a clean horizontal layout and intuitive branching structure, it helps presenters communicate complex insights in a visually balanced and engaging way. Its modern iconography and subtle color accents make it suitable for professional presentations across corporate, project management, and consulting contexts.
What’s Inside the Template
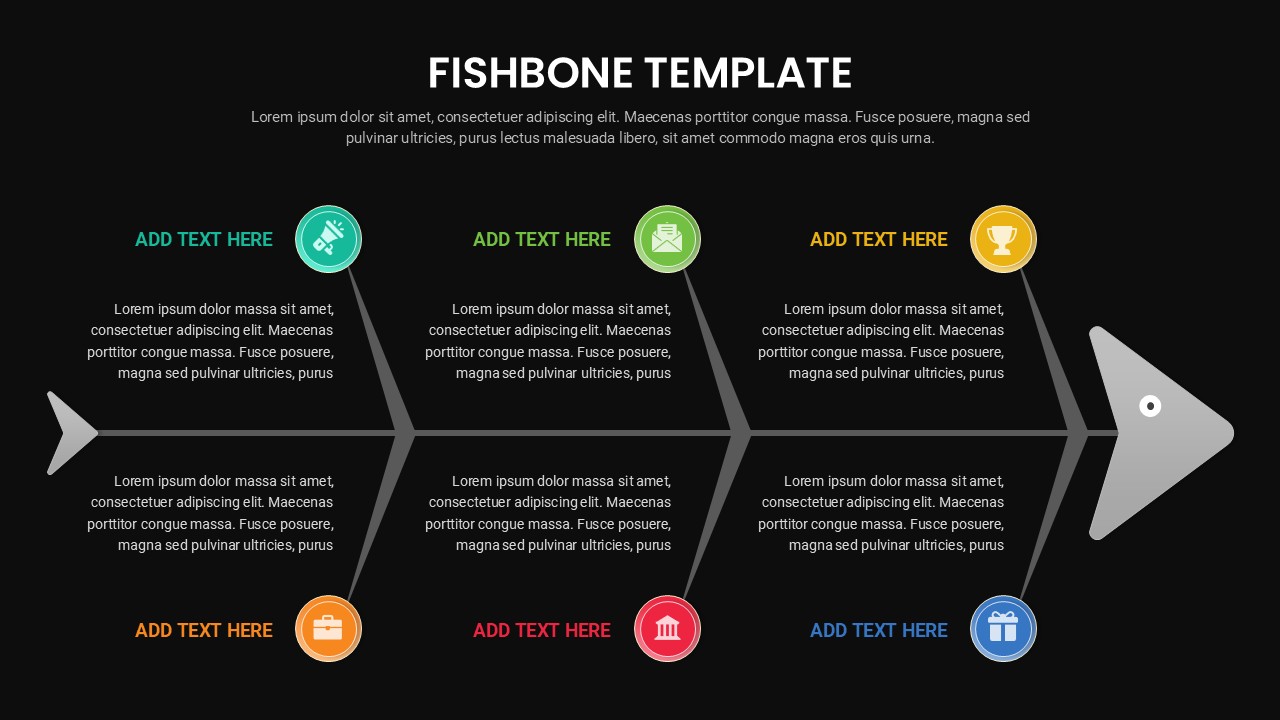
The template features a traditional Ishikawa-style fishbone diagram stretched horizontally for maximum readability. Each branch contains editable text areas for outlining major cause categories, accompanied by color-coded circular icons to visually separate themes. Supporting sub-text sections allow additional context or descriptive analysis under each branch. The diagram terminates in the fish “head,” where users can specify the main problem or effect being examined. All elements—including connectors, icons, and text blocks—can be fully customized to match branding and presentation needs.
Key Features
- Fully editable fishbone (Ishikawa) diagram structure
- Distinct multi-color icon markers for rapid visual interpretation
- Spacious text fields enabling detailed cause documentation
- Balanced horizontal alignment for improved clarity during presentations
- Compatible with both PowerPoint and Google Slides
- Designed with a modern and clean aesthetic that adapts to any business theme
Ideal For
This template is ideal for business strategists, project managers, consultants, quality assurance teams, educators, and analysts seeking a reliable visual model for exploring root causes. It is especially valuable during brainstorming sessions, risk assessments, retrospectives, and workshop facilitation.
Slide Highlights
- Eight structured branches representing various contributing factors
- Visual hierarchy supported by icons for categories such as operations, communication, achievements, and organizational elements
- Clean arrow-based spine reflecting the central analysis pathway
- Consistent spacing and layout to maintain readability even with detailed text
- A prominent final node for stating the core issue or effect being analyzed
Compatibility & Formats
This template works seamlessly with both Microsoft PowerPoint and Google Slides, ensuring easy editing, team collaboration, and broad accessibility across devices and platforms.
Login to download this file
What do you think of this template?
Category:
Diagrams
Aspect Ratio: 16:9
Item ID: SPT0098
Color


