Fish Bone Diagram Infographic
This template is part of a deck featuring multiple slides. To check out all slides.
See All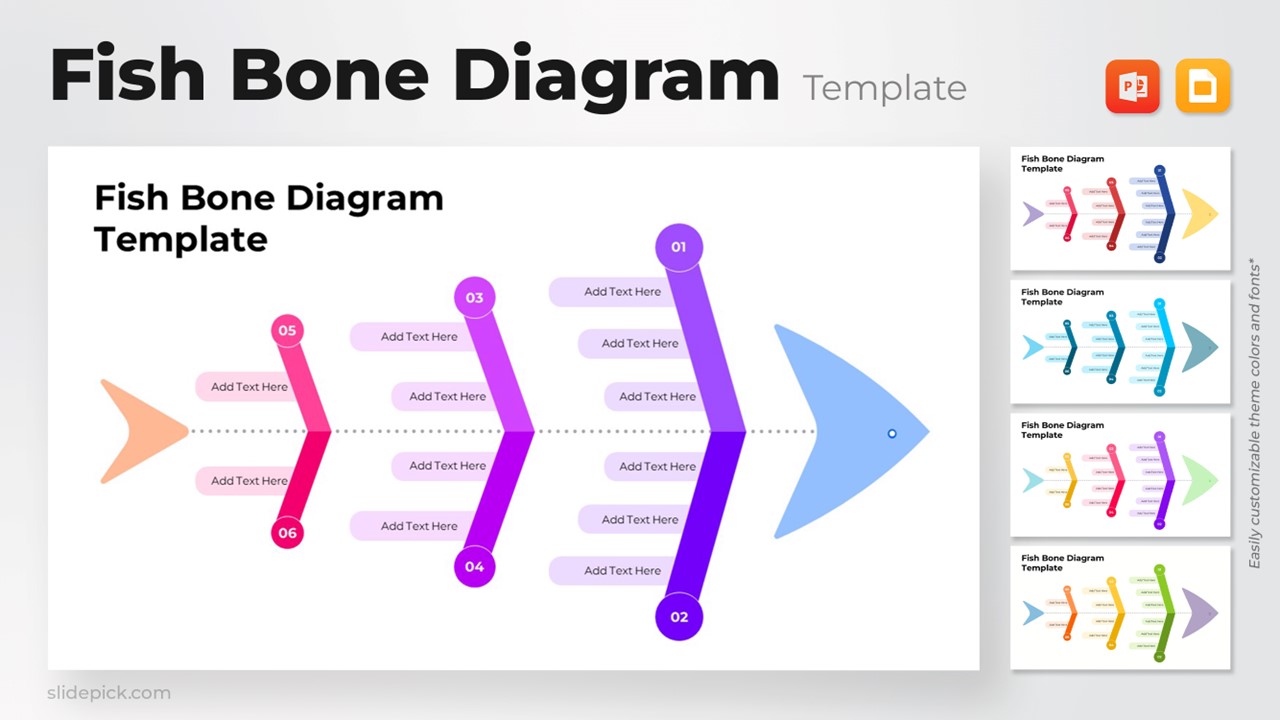
Product Description
Description
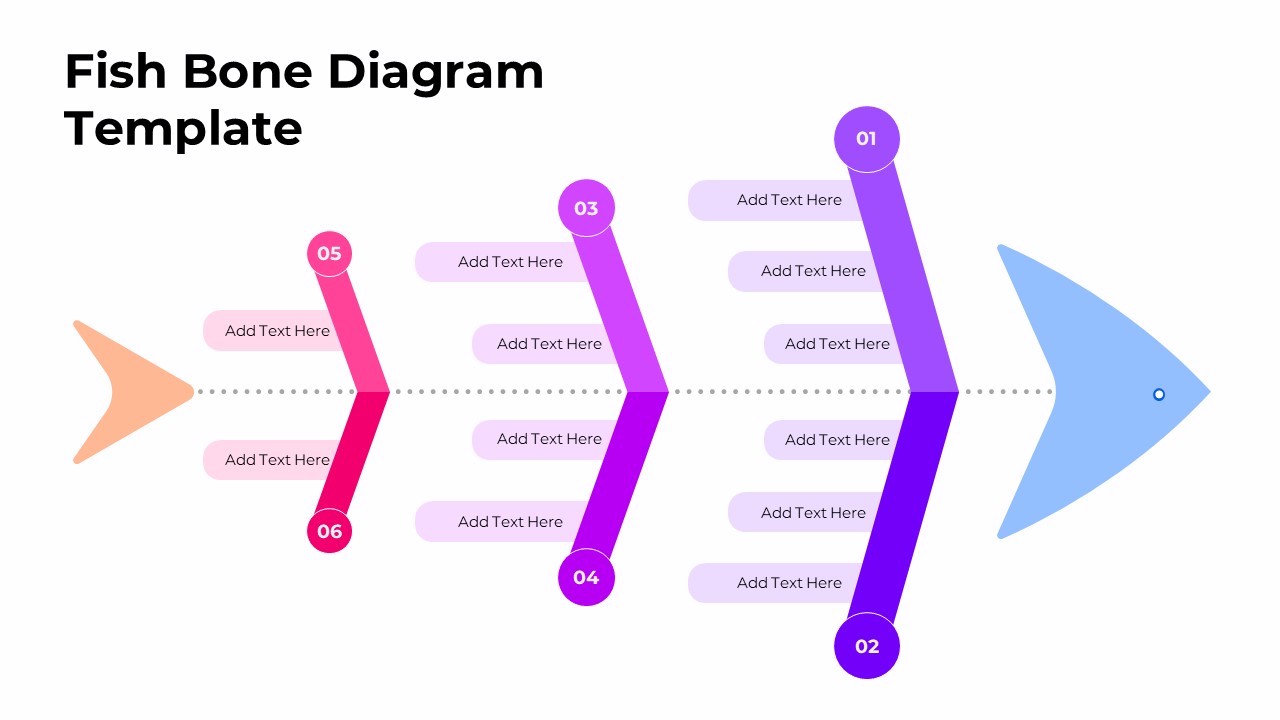
This Fishbone Diagram Analysis Template offers a clear and visually compelling structure for identifying root causes, categorizing issues, and presenting problem-solving insights in an organized way. With its clean, modern gradient color palette and balanced layout, the template helps teams visually map connections between contributing factors and core challenges. Ideal for analytical presentations, it supports data-driven discussions and collaborative decision-making across business, project, and operational settings.
What’s Inside the Template
The template features a horizontally oriented fishbone (Ishikawa) diagram composed of six primary branches, each labeled with a numbered circle for easy navigation. Every branch contains multiple text fields that let presenters break down causes into sub-categories and supporting details. The central spine maintains coherence, while the color-coded sections guide the audience through distinct factor groups. The diagram is spacious, editable, and optimized for both short insights and detailed annotations.
Key Features
- Fully editable fishbone structure with six major cause categories
- Clean and modern color gradients for visual clarity
- Intuitive left-to-right cause-to-effect flow
- Ample text space for detailed notes
- Easy customization for business, technical, or strategic discussions
- Suitable for problem diagnosis, brainstorming, and root cause analysis
Ideal For
- Business managers analyzing operational inefficiencies
- Project teams addressing recurring project issues
- Consultants conducting root-cause assessments
- Quality improvement and process optimization initiatives
- Strategy teams identifying obstacles behind key challenges
Slide Highlights
The diagram’s symmetrical layout enhances readability, while numbered nodes (01–06) help presenters structure discussions and maintain logical flow. Branches extend from the central axis with clearly defined text placeholders, allowing users to segment information neatly. The head and tail elements of the fish add directional emphasis, reinforcing the cause-to-effect storytelling. The color gradient across branches—from pink to purple to blue—creates a visually engaging progression without distracting from analytical content.
Compatibility & Formats
The template is fully compatible with:
- Microsoft PowerPoint (.pptx)
- Google Slides
- Fully editable shapes, colors, and text fields
Login to download this file
What do you think of this template?
Category:
Business
File size: 16:9
Item ID: SPT0137
Color
