SIPOC Template
This template is part of a deck featuring multiple slides. To check out all slides.
See AllProduct Description
Description
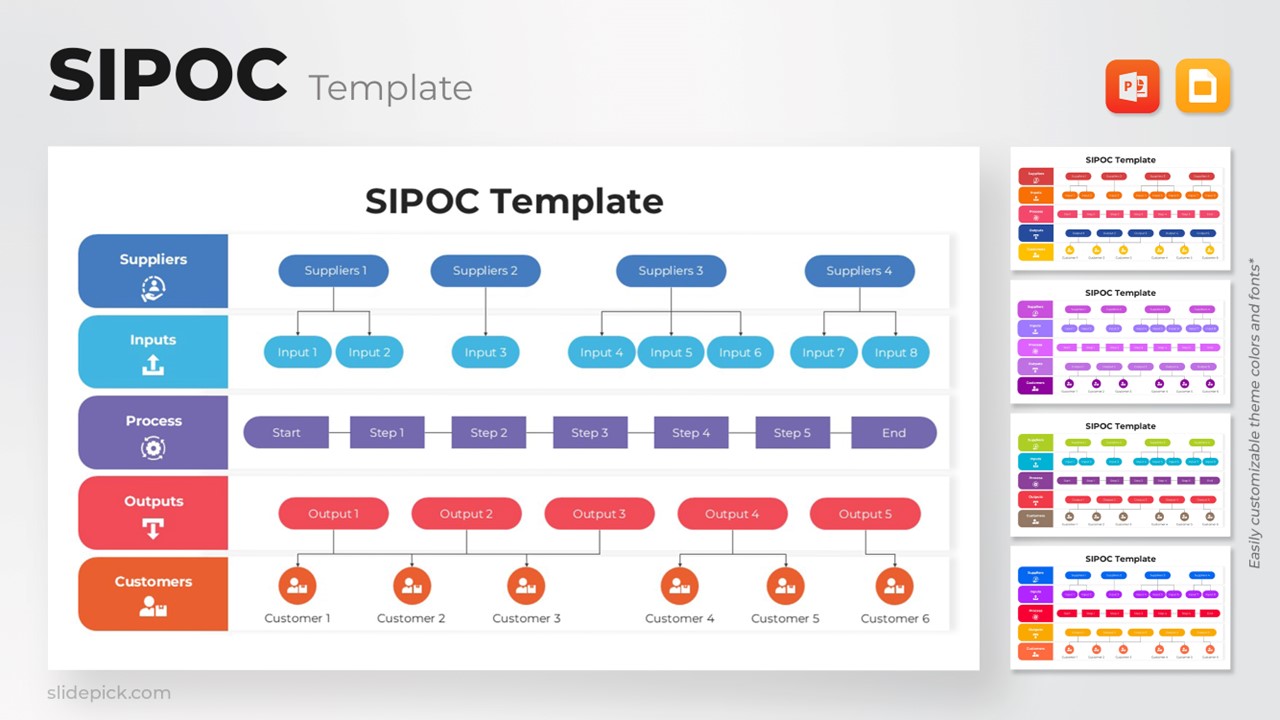
This SIPOC Process Mapping Diagram provides a structured and visually engaging way to capture the core elements of any operational workflow. Designed to help teams clarify suppliers, inputs, process steps, outputs, and customers, the template serves as a concise, high-level overview that supports improvement initiatives and cross-functional alignment. Its clean layout and color-coded sections make it easy to present complex processes in a format that both technical and non-technical audiences can quickly understand.
What’s Inside the Template
The template includes a complete SIPOC framework divided into five horizontal bands Suppliers, Inputs, Process, Outputs, and Customers. Each band contains neatly arranged placeholders that allow users to specify key contributors, resources, step-by-step activities, resulting outputs, and end-users. The central process line spans from “Start” to “End,” with dedicated slots for sequential steps. This structure ensures teams can map processes consistently and spot dependencies or inefficiencies at a glance.
Key Features
- Clear SIPOC breakdown for streamlined process documentation
- Distinct color sections for enhanced readability
- Pre-built input/output hierarchy for organized mapping
- Editable shapes and labels for full customization
- Balanced layout ideal for workshops, training, audits, and improvement planning
Ideal For
This template is ideal for operations teams, project managers, business analysts, Lean Six Sigma practitioners, and consultants seeking a reliable tool for process evaluation. It also supports onboarding, internal communication, and stakeholder presentations where high-level process clarity is essential.
Slide Highlights
The Suppliers and Inputs sections use a branch-style layout to illustrate resource relationships, helping viewers see how various inputs feed the process. The Process row presents a linear flow of steps for structured mapping, while the Outputs and Customers rows use aligned nodes to show how deliverables connect directly to end-users. The crisp icons and bold headers strengthen visual interpretation, keeping audiences focused and engaged.
Compatibility & Formats
Fully compatible with PowerPoint and Google Slides, the template is easy to edit, resize, and adapt to different presentation styles. All elements are vector-based, ensuring sharp visuals on any screen size.
Login to download this file
What do you think of this template?
Category:
Business
File size: 16:9
Item ID: SPT0130
Color
