United States Map Infographic Presentation Template for PowerPoint & Google Slides

Product Description
Overview
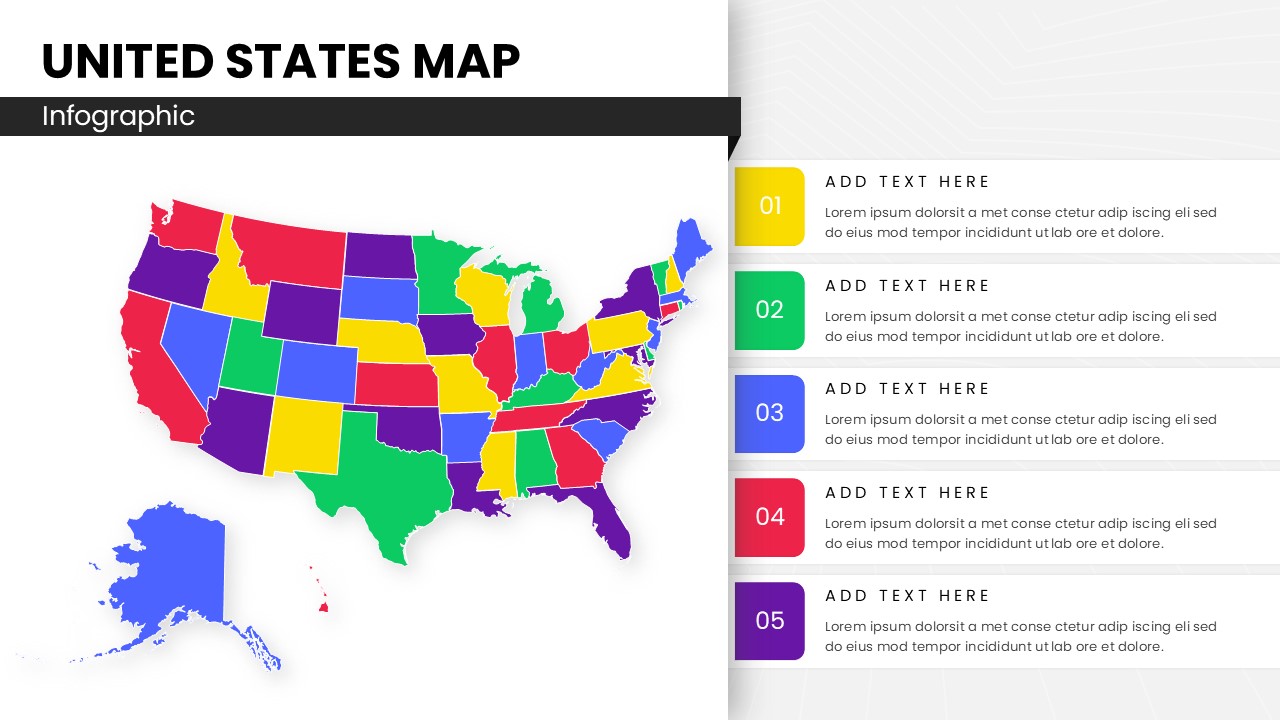
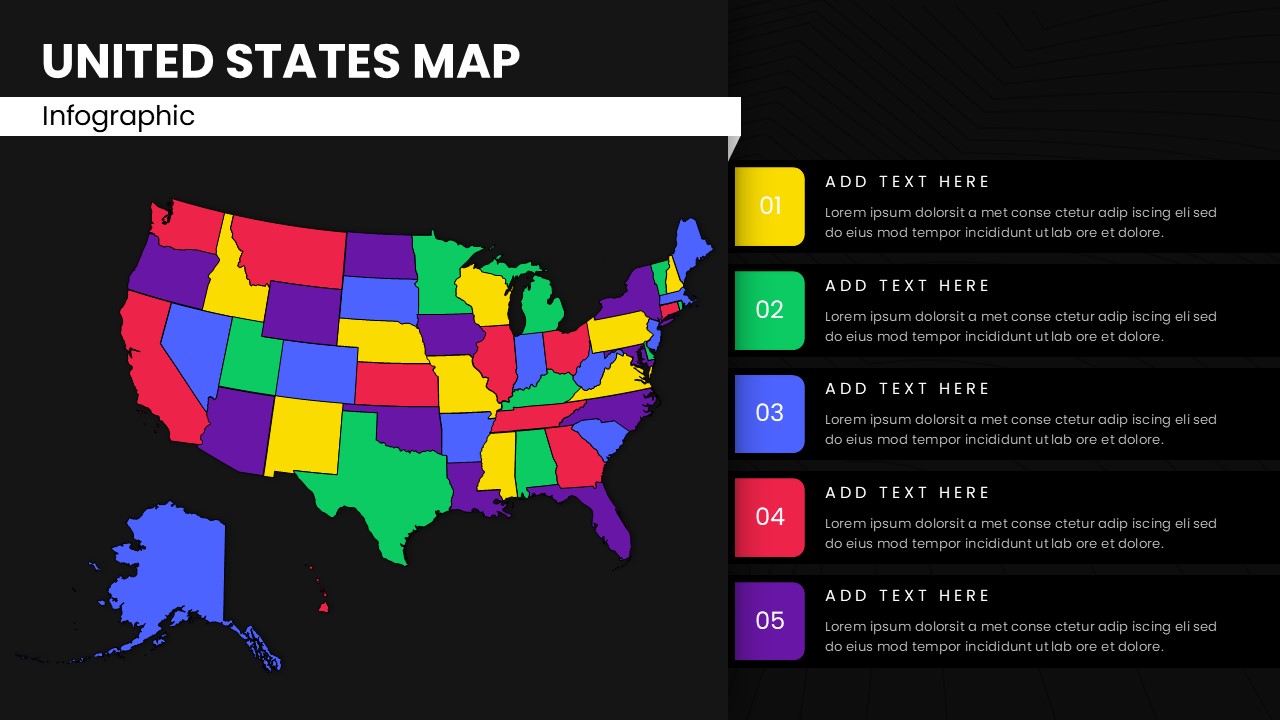
This presentation template showcases a visually engaging United States map infographic suitable for data visualization, regional comparisons, and geographic presentations. It is a fully editable presentation template compatible with PowerPoint and Google Slides. The design uses a bright multi color map paired with numbered text blocks to help presenters highlight state specific information or regional insights.
The clean white background and modern layout emphasize clarity, making it ideal for professional, educational, and analytical use.
The template serves presenters who need a straightforward and visually appealing way to communicate geographic distributions, location based statistics, operational coverage, or market segmentation across the United States. Its structured side panel provides an organized space to expand on key points linked to numbered markers.
What’s Inside the Template
The template contains a high resolution United States map with each state differentiated by bold, contrasting colors. To the right of the map, five vertically aligned text blocks are presented with distinctive color coded markers, allowing users to connect regional insights or thematic information to specific areas on the map. The layout is designed to support narrative explanations, summaries, or data driven commentary.
The spacious arrangement and simplified styling offer flexibility for customizing state colors, adding labels, adjusting fonts, or modifying section numbers to fit your communication needs.
Key Features
- Fully editable multi color US map with individually styled states
- Five numbered text sections for structured explanations
- Clean, modern layout optimized for presentations and reporting
- Bright color coding for clear state differentiation
- Suitable for data visualization, geographic summaries, and market insights
- Compatible with PowerPoint and Google Slides
Ideal For
This template is ideal for educators presenting geography content, analysts sharing regional statistics, business teams outlining territorial strategies, and nonprofits showcasing service coverage. It also supports marketing, research, and corporate planning presentations that require a clear view of US regions.
Slide Highlights
The map features highly saturated color segments that make each state visually distinct, allowing for quick recognition and comparison. The right side panel includes numbered blocks with coordinating colors, offering a clean connection between narrative points and specific areas on the map. The overall composition balances visuals and text to maintain clarity and professional appeal.
Compatibility & Formats
The template works seamlessly with PowerPoint and Google Slides. Users can edit colors, shapes, text blocks, and formatting to match their branding or presentation requirements. It is optimized for both digital display and printed output.
Login to download this file
What do you think of this template?
Category:
Business Reports
Aspect Ratio: 16:9
Item ID: SPT0333
Color
Related Templates
-
-
-
-
-
-
-
Editable Germany Map for PowerPoint & Google Slides
Infographics
-
-
-
-
-


