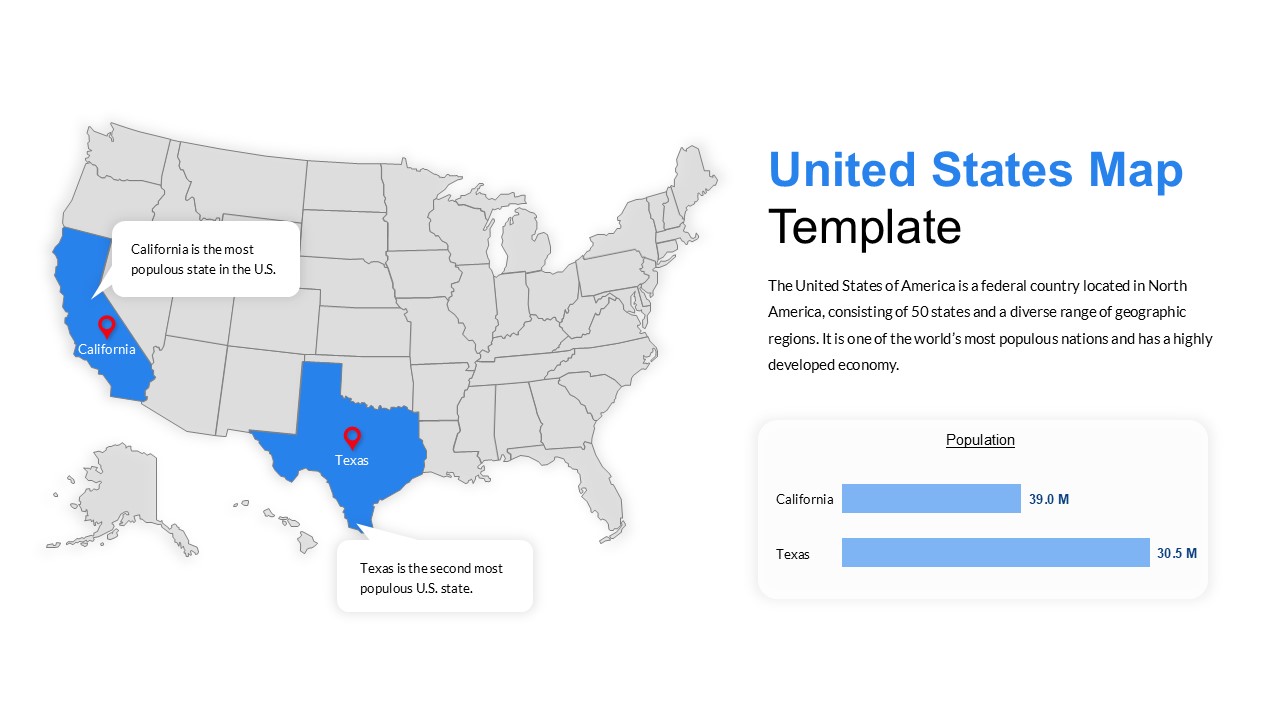
Editable United States Map Template
Related Templates
-

-
-
-
-
-
-
-
-
-
Pie Chart Data Breakdown Template for PowerPoint & Google Slides
Charts & Graphs
-
Pie Chart Data Breakdown Template for PowerPoint & Google Slides
Charts & Graphs
-


Charts & Graphs

Charts & Graphs

