SEO Performance Dashboard Analytics Template for PowerPoint & Google Slides
Product Description
SEO Report Dashboard Template
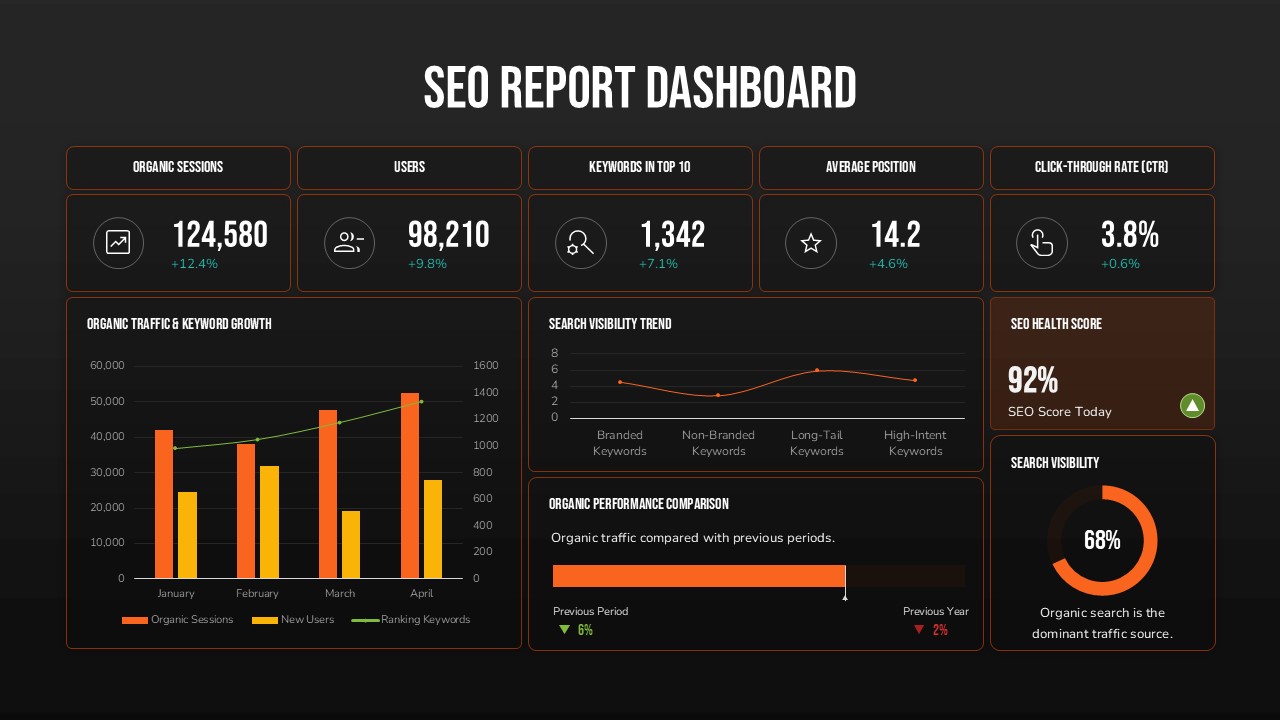
This template presents a complete SEO reporting dashboard designed to help teams communicate performance outcomes with clarity and precision. The product is a fully editable presentation template, compatible with PowerPoint and Google Slides. It enables marketers, analysts, and executives to track SEO metrics visually while highlighting growth trends. The design features a dark data centric layout that emphasizes key indicators and supports structured reporting presentations.
What’s Inside the SEO Dashboard Template
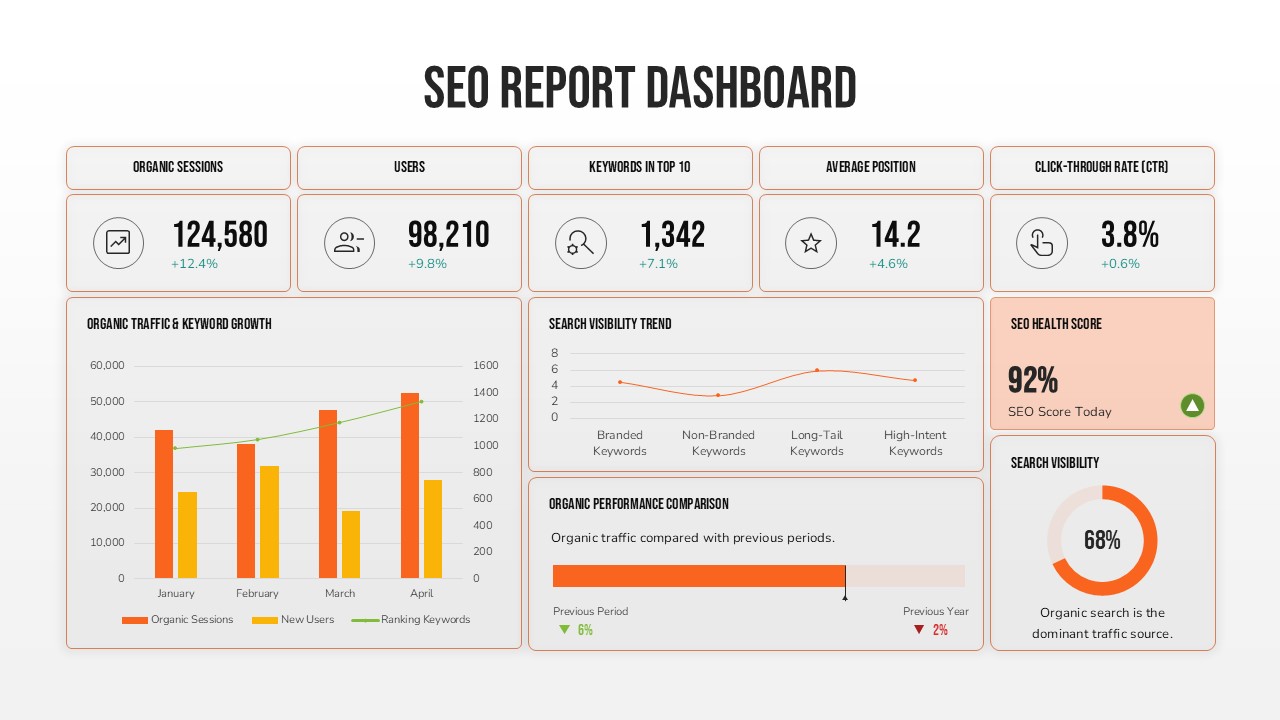
The slide includes a set of metric summary panels displaying organic sessions, users, keyword rankings, average position, and click through rate. These indicators sit above a detailed analytics section that showcases organic traffic and keyword growth using bar and line charts. Additional visual components include a search visibility trend chart, an organic performance comparison bar, a health score gauge, and a visibility indicator. The template balances numerical data with graphical insights, helping audiences understand SEO performance at a glance.
Key Features of SEO Report Template
- Fully editable charts, icons, and data values
- High contrast dashboard layout optimized for analytical reporting
- Multiple chart formats including bars, lines, and gauges
- Clear visual hierarchy strengthening data storytelling
- Designed for SEO, analytics, and marketing performance presentations
- Works seamlessly in both PowerPoint and Google Slides
Ideal For
Marketing teams presenting monthly SEO results, agencies reporting campaign outcomes to clients, and in house analysts summarizing website performance. It also supports strategic planning meetings where leaders need a visual overview of traffic behavior, keyword shifts, and visibility progress.
Slide Highlights
The dashboard style layout creates an immediate understanding of performance metrics through visually distinct sections. The top summary row highlights core KPIs, while the lower segments provide deeper analysis such as growth trends and period comparisons. The circular visibility gauge and health score modules introduce strong visual anchors that make complex insights easier to communicate.
Compatibility & Formats
This template works with both PowerPoint and Google Slides. All charts and elements can be edited to reflect real data, allowing teams to align the dashboard with evolving SEO performance metrics.
Login to download this file
What do you think of this template?
Category:
Business Reports
Aspect Ratio: 16:9
Item ID: SPT0399
Color


