SWOT Bar Chart Analysis Infographic Template for PowerPoint & Google Slides
Product Description
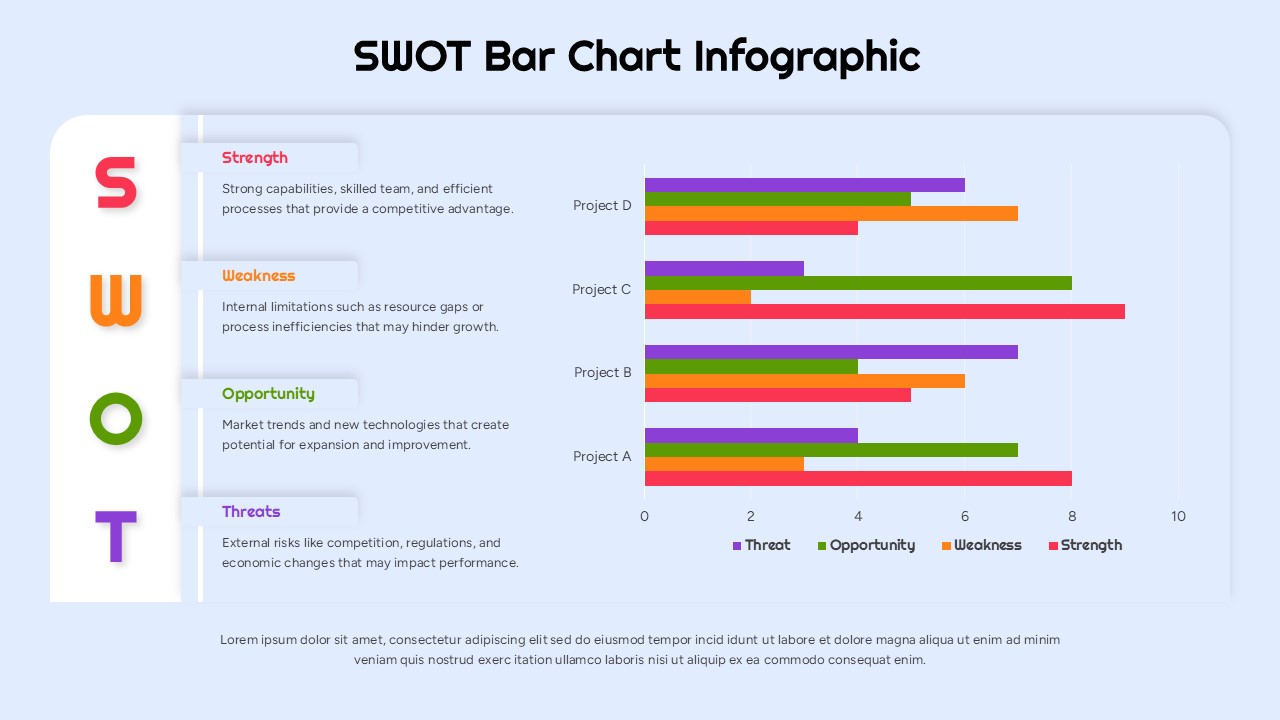
SWOT Bar Chart Infographic
This template presents a structured SWOT analysis using a bar chart format to compare strengths, weaknesses, opportunities, and threats across multiple projects. It is a fully editable presentation template compatible with PowerPoint and Google Slides.
Its purpose is to help teams visually interpret project performance factors and strategic positions through clear, comparative metrics.
The design uses color coded bars and neatly organized headings to enhance readability and analytical clarity.
It supports strategic planning sessions, performance reviews, and decision making presentations that require clear data visualization.
What’s Inside the SWOT Bar Chart Template
The template features a two part layout: the left column displays descriptive summaries of the four SWOT categories, while the right section presents a horizontal bar chart comparing these categories across four sample projects. Each bar is color coded to match its corresponding SWOT factor, allowing for immediate visual distinction. Subtle grid lines and labeled axes provide structure for accurate interpretation. The layout is clean, spacious, and optimized for presenting both qualitative explanations and quantitative comparisons in a single view.
Key Features SWOT Bar Chart Template
- Fully editable SWOT bar chart visualization
- Color coded bars for Strength, Weakness, Opportunity, and Threat
- Combined descriptive and analytical layout
- Clear axis labeling to support data interpretation
- Compatible with PowerPoint and Google Slides
Ideal For
This template is ideal for managers, analysts, consultants, educators, and project teams conducting strategic assessments. It supports presentations related to business planning, performance evaluation, competitive analysis, risk assessment, and organizational strategy development.
Slide Highlights
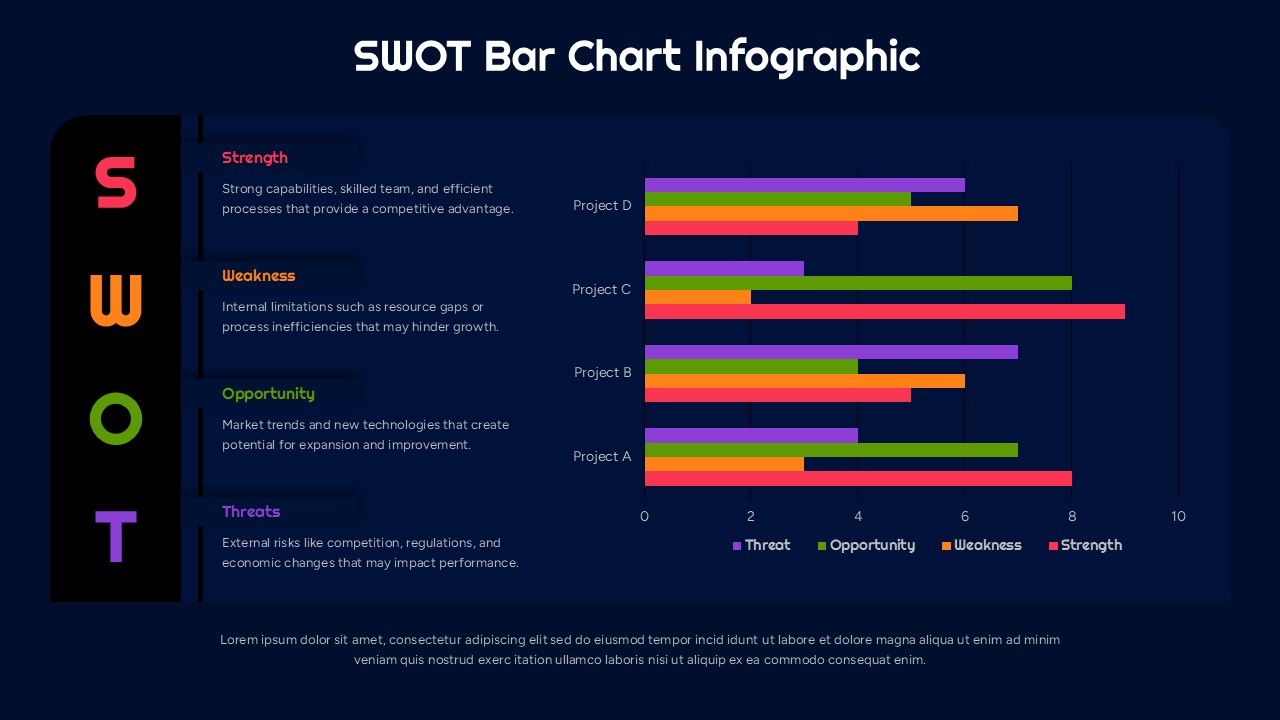
The slide blends narrative and numerical insights by placing the SWOT definitions on the left and the comparative bar chart on the right. Distinct colors highlight each SWOT factor, making differences across projects easy to recognize. The smooth rounded shapes and soft background create a modern visual style, while balanced spacing ensures clarity even when customized with additional data.
Compatibility & Formats
The template is fully compatible with PowerPoint and Google Slides. All chart elements, labels, colors, and text blocks can be edited to reflect project specifics, branding guidelines, or presentation goals.
Login to download this file
What do you think of this template?
Category:
Business
Aspect Ratio: 16:9
Item ID: SPT0467
Color
Related Templates
-
-
-
-
-
STEEPLE Analysis Framework Infographic for PowerPoint & Google Slides
Business Strategy
-
-
-
-
-
-
-


