Break Even Analysis Presentation Template for PowerPoint & Google Slides
Product Description
Break-Even Analysis Template
This break even analysis presentation template is designed to help users evaluate when revenue will cover total costs in a business setting. It is a fully editable presentation template, compatible with PowerPoint and Google Slides. The slide visually demonstrates the relationship between fixed costs, variable costs, and revenue. It also highlights the point at which profit begins, supporting clearer financial decision making.
The template presents a professional chart layout that simplifies complex financial data. Its structure makes it suitable for explaining pricing strategies, forecasting profitability, or communicating financial insights to stakeholders. With a clean modern design, the slide supports both internal analysis and client facing presentations.
What’s Inside the Break-Even Analysis Template
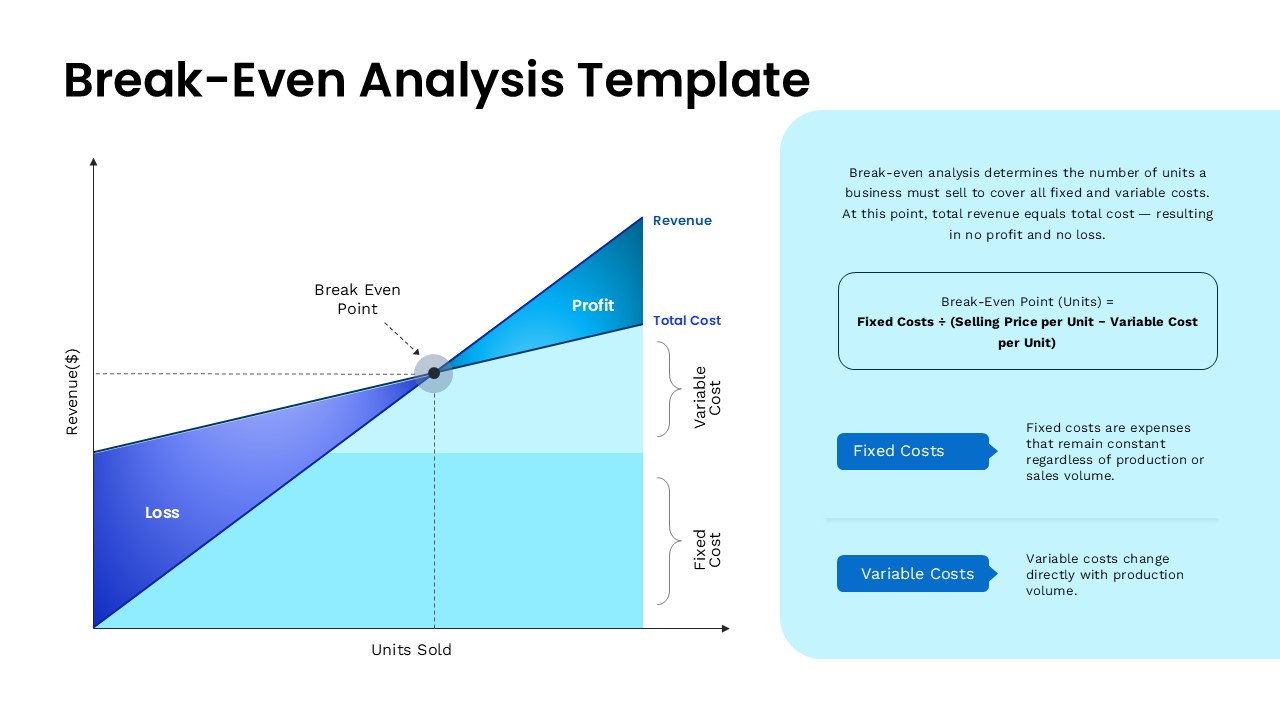
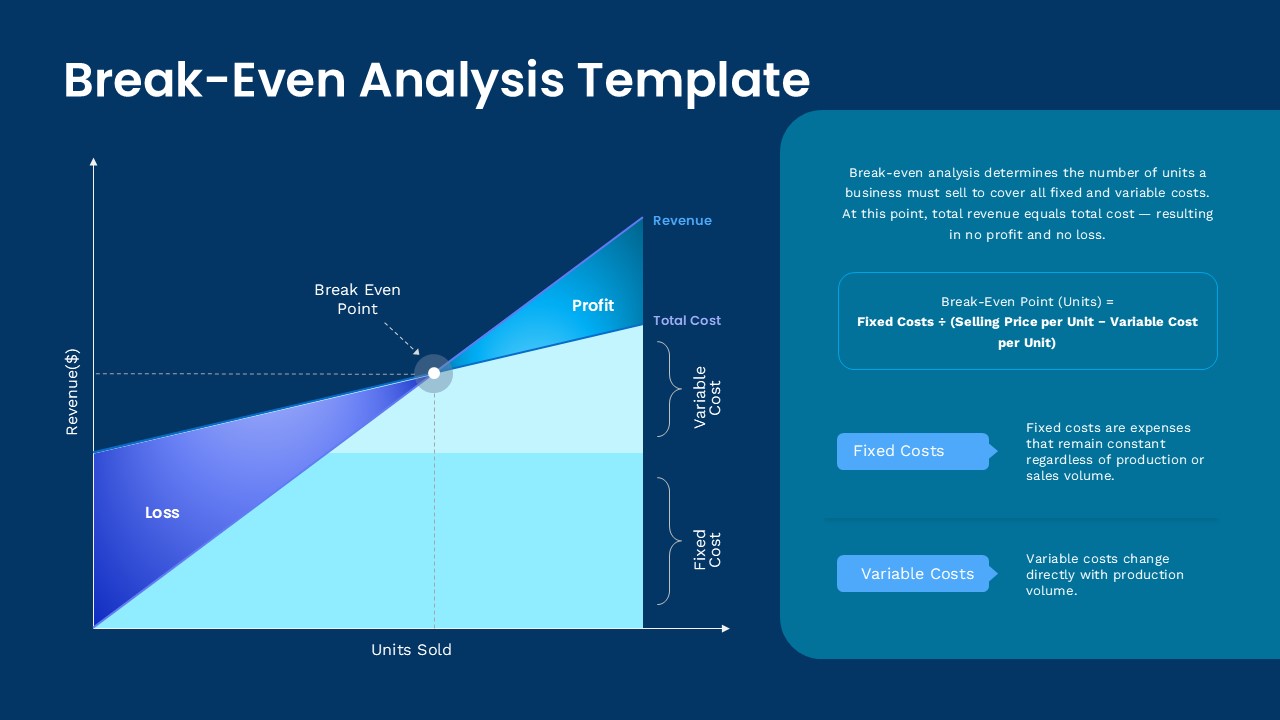
The template features a break even graph with defined revenue, total cost, fixed cost, and variable cost areas. A central marker indicates the break even point where total revenue matches total cost. A descriptive panel on the right side provides a concise formula for calculating break even units along with explanations of fixed and variable costs. Clear color separation between profit and loss regions enhances readability and supports financial interpretation.
Key Features of Break-Even Analysis Template
• Fully editable chart and text fields for tailored business analysis
• Clear visual separation of cost structures and profit regions
• Professional layout suitable for financial presentations
• Break even formula included for quick reference
• Modern color scheme that enhances data clarity
• Compatible with PowerPoint and Google Slides
Ideal For
Business analysts, financial planners, sales teams, consultants, entrepreneurs, and educators who need a visual way to explain cost behavior, evaluate pricing decisions, or present profitability scenarios. It works well for budget planning, investor presentations, and financial training sessions.
Slide Highlights
The main chart displays revenue and cost lines intersecting at the break even point, allowing audiences to quickly interpret profit and loss boundaries. The shaded cost areas reinforce the distinction between fixed and variable expenses. The right information panel adds contextual clarity, making the template both analytical and instructional. The combination of visual and textual elements supports confident financial communication.
Compatibility & Formats
This template is ready for use in PowerPoint and Google Slides. All elements, including chart components, colors, shapes, and explanatory text, can be fully customized for specific business needs. It can also be exported as a static document for reports or printed materials.
Login to download this file
What do you think of this template?
Category:
Finance
Aspect Ratio: 16:9
Item ID: SPT0491
Color


