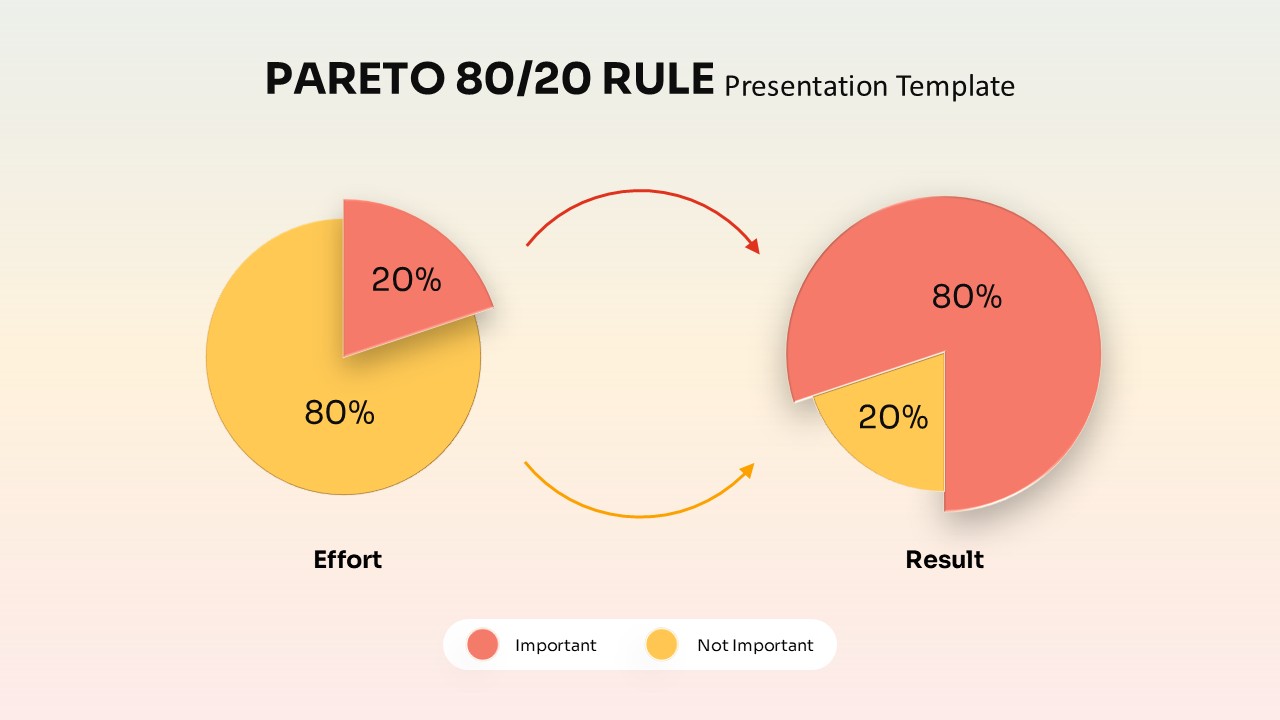
Transform your business strategy presentation with this elegant Pareto 80/20 Rule visualization. Two connected pie charts with flowing arrows demonstrate how 80% effort yields 20% results, while 20% focused effort drives 80% of outcomes. The clean cream background, coral and golden color scheme, and professional typography create an impactful slide that clearly communicates this fundamental business principle. Perfect for management presentations, productivity training, or strategic planning sessions. Fully editable in PowerPoint and Google Slides to match your brand colors and content.