Pareto 80/20 Rule Chart PowerPoint & Google Slides Template


Product Description
Pareto 80/20 Rule
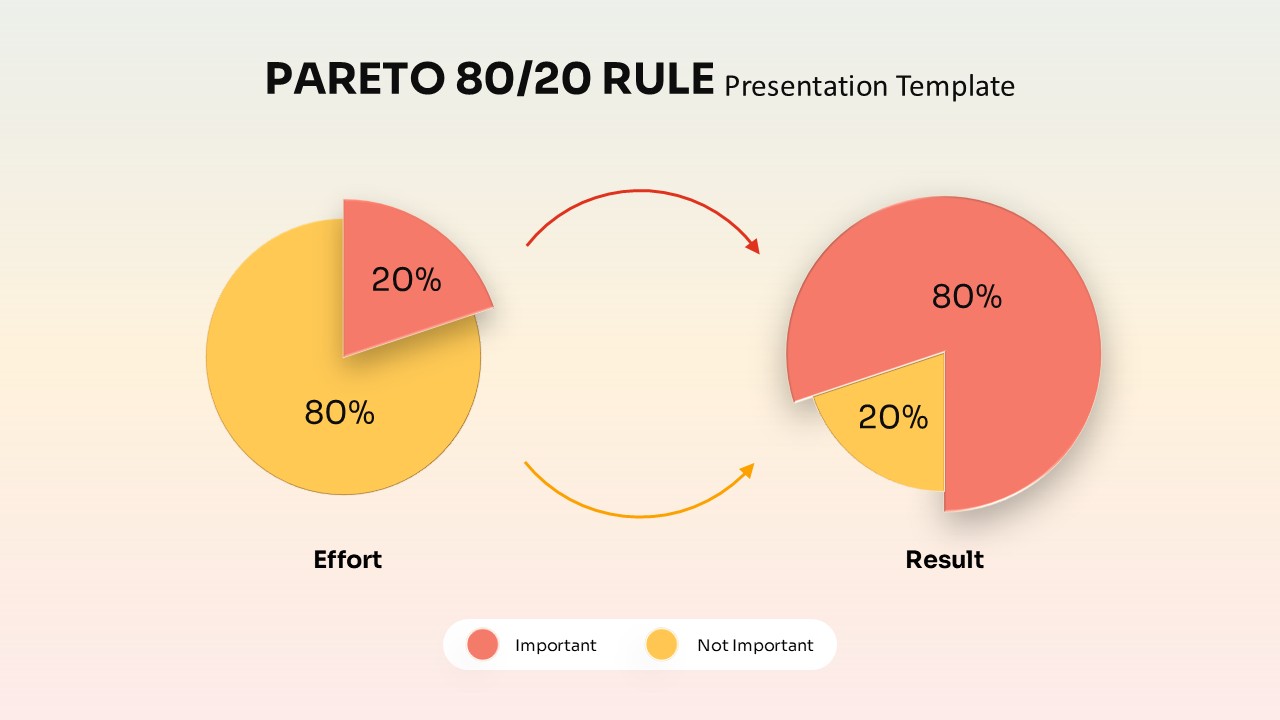
Transform your business presentations with our professional Pareto 80/20 Rule template. This powerful visualization tool helps you communicate the fundamental principle that 80% of results come from 20% of efforts. Perfect for strategy sessions, process improvement presentations, and efficiency analysis, this template delivers clear visual impact through well-designed pie charts and flow indicators.
What’s Inside the Pareto 80/20 Rule Template
This comprehensive template includes 2 professionally designed slides featuring the classic Pareto distribution. Each slide showcases dual pie charts connected with curved flow arrows, demonstrating the relationship between effort and results. The template provides both light and dark theme options, ensuring seamless integration with your existing presentation style.
Key Features of Pareto 80/20 Rule Template
- Professional pie chart visualizations with 80/20 distribution
- Curved flow arrows showing effort-to-result relationship
- Light and dark theme variations for presentation flexibility
- Fully editable text placeholders and data labels
- Clean, modern design with optimal white space usage
- High-contrast color scheme for excellent readability
Ideal For
Business analysts, consultants, project managers, and executives will find this template invaluable for presenting efficiency concepts. Whether you’re conducting training sessions, strategic planning meetings, or client presentations, this template effectively communicates priority management and resource allocation principles across various industries and business contexts.
Slide Highlights
The template features a sophisticated coral red and golden yellow color palette against cream and charcoal backgrounds. Each slide maintains consistent positioning with centered titles, bottom legends, and symmetrical chart placement. The curved connecting arrows create visual flow while the flat design aesthetic ensures professional presentation standards.
Compatibility & Formats
Designed for seamless use in both PowerPoint and Google Slides platforms. The 16:9 aspect ratio ensures optimal display on modern screens and projectors. All elements are fully customizable, allowing you to modify colors, text, and data percentages to match your specific presentation requirements and brand guidelines.
Frequently Asked Questions
Can I modify the percentage values in the pie charts?
Yes, all chart elements are fully editable. You can easily adjust the percentage distributions, colors, and labels to reflect your specific data while maintaining the professional design aesthetic.
Does this template work with both light and dark presentation themes?
Absolutely. The template includes both light background and dark background variations, ensuring seamless integration regardless of your overall presentation theme or corporate brand requirements.
What business scenarios work best with this Pareto template?
This template excels in business strategy presentations, process optimization meetings, time management training, quality analysis, sales performance reviews, and any scenario where you need to illustrate the 80/20 principle of effort versus results.
Login to download this file
What do you think of this template?
Category:
Charts & Graphs
Aspect Ratio: 16:9
Item ID: SPT0535
Color
Related Templates
-
-
Organization Challenges Hub Diagram PowerPoint & Google Slides Template
Business Strategy
-
-
-
-
-
MECE Principle Diagram Template for PowerPoint & Google Slides
Business Strategy
-
-
Jigsaw Puzzle Google Slides & PowerPoint Template
Infographics
-
STEEPLE Analysis Framework Infographic for PowerPoint & Google Slides
Business Strategy
-
Blue Ocean Strategy Canvas Infographic for PowerPoint & Google Slides
Business Strategy
-


