Radial Gauge Chart Google Slides & PowerPoint Template
Product Description
Radial Gauge Chart Presentation
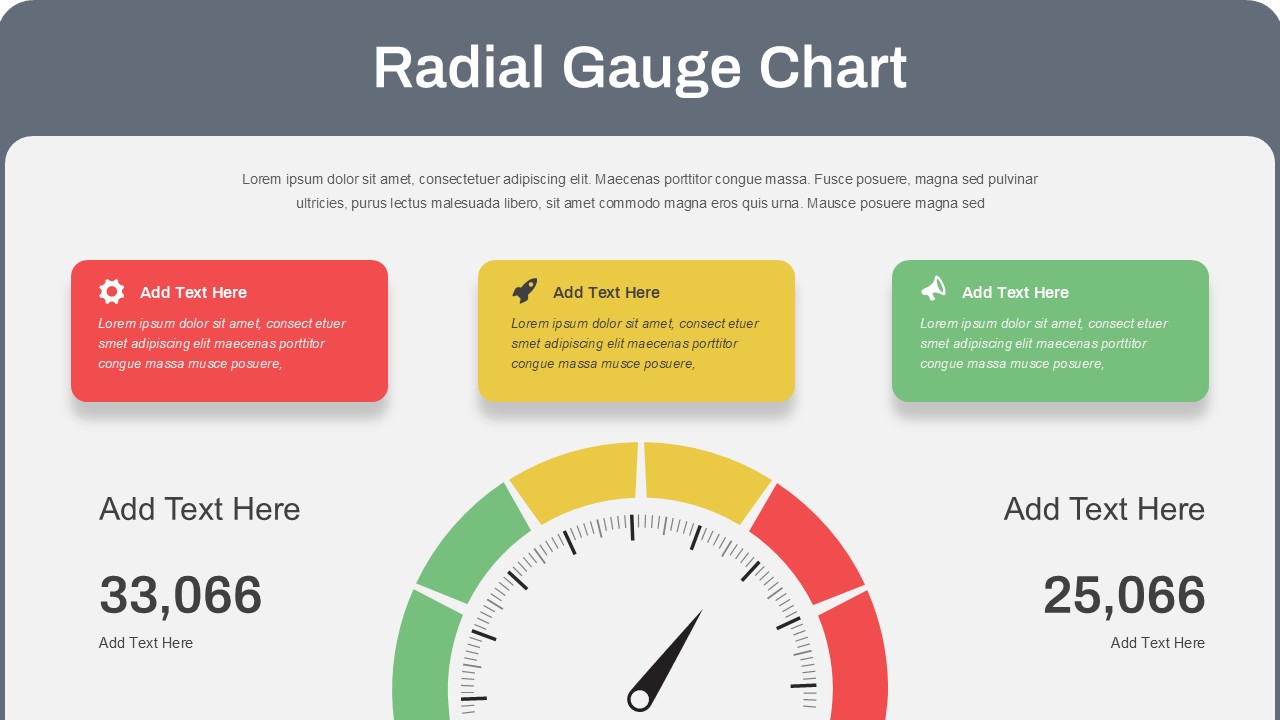
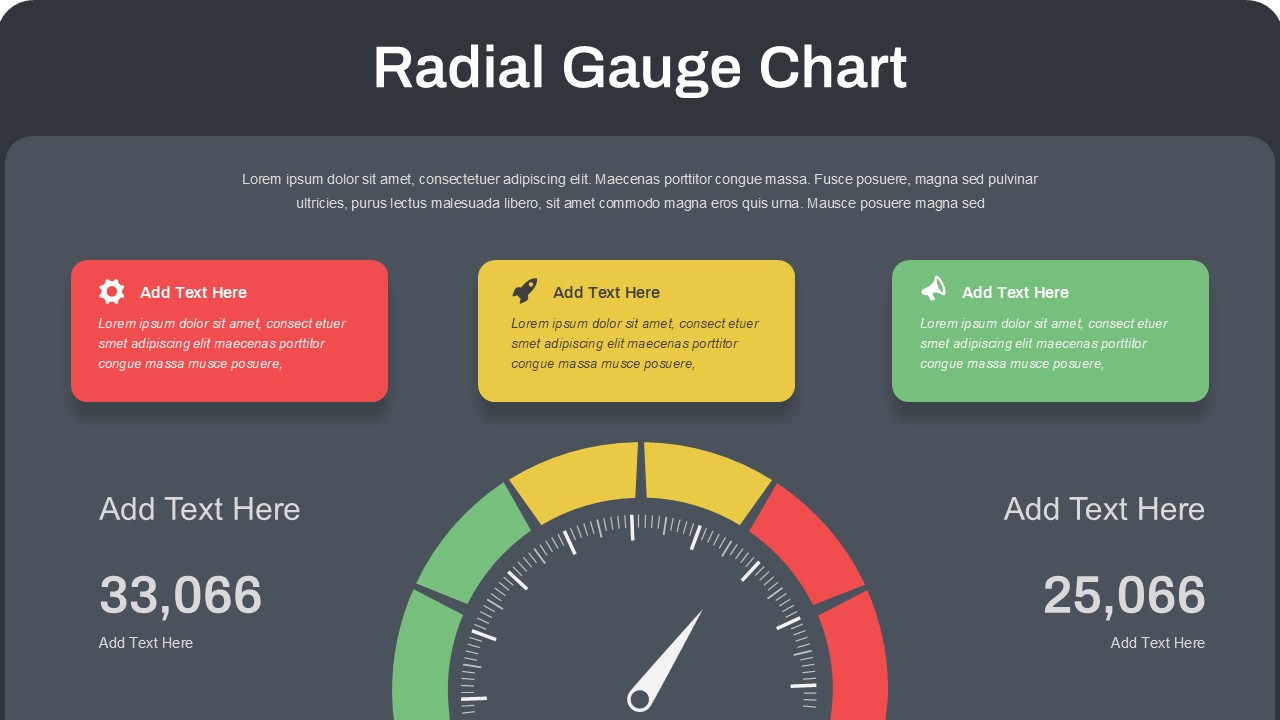
This professional radial gauge chart template transforms complex data into visually compelling presentations that capture audience attention instantly. Featuring both dark and light theme variations, the template combines modern design aesthetics with practical functionality to help you communicate performance metrics, KPIs, and progress indicators effectively. The semi-circular gauge design with needle indicators provides an intuitive way to display measurable outcomes, making it perfect for executive presentations where clear data visualization is essential.
What’s Inside the Radial Gauge Chart Template
The template includes two expertly designed slides featuring symmetrical dashboard layouts with central radial gauge charts as focal points. Each slide incorporates three colored information boxes arranged horizontally at the top, complemented by numerical KPI displays positioned strategically on both sides of the gauge. The design includes customizable icons (gear, rocket, airplane), placeholder text sections, and dedicated areas for metric values. Both dark and light theme variations maintain consistent visual hierarchy while offering flexibility for different brand guidelines and presentation contexts.
Key Features of Radial Gauge Chart Template
- Dual theme options with dark and light background variations
- Semi-circular radial gauge with adjustable needle indicators
- Three customizable information boxes with icon placeholders
- Dedicated KPI display areas for numerical metrics
- Professional color scheme with coral red, golden yellow, and sage green accents
- High contrast text elements for excellent readability
- Symmetrical layout design with clear visual hierarchy
- Fully editable elements including charts, text, and colors
Ideal For
This template serves business executives, project managers, data analysts, and consultants who need to present performance metrics and KPIs effectively. It’s particularly valuable for quarterly business reviews, project status meetings, and executive dashboards where stakeholders need to quickly understand progress toward goals. The design works exceptionally well for business reports that require clear data visualization and professional presentation standards across various industries including finance, manufacturing, and technology sectors.
Slide Highlights
The template features a sophisticated color palette combining charcoal gray backgrounds with vibrant accent colors that create visual impact without overwhelming the data presentation. The radial gauge charts use modern flat design principles with subtle shadows and clean typography that ensures information remains accessible and professional. Each slide maintains perfect balance through strategic white space usage and consistent element positioning, while the high contrast text treatment guarantees readability in both boardroom and digital presentation environments.
Compatibility & Formats
Fully compatible with both PowerPoint and Google Slides platforms, this template ensures seamless editing across different software environments. All elements including charts and graphs, text placeholders, icons, and color schemes are completely customizable to match your brand requirements and presentation needs. The 16:9 aspect ratio provides optimal display quality for modern presentation screens and digital sharing platforms.
Login to download this file
What do you think of this template?
Category:
Business
Aspect Ratio: 16:9
Item ID: SPT0546
Color


