Pareto 80/20 Rule Google Slides & PowerPoint Template

Product Description
Pareto 80/20 Rule Presentation Template
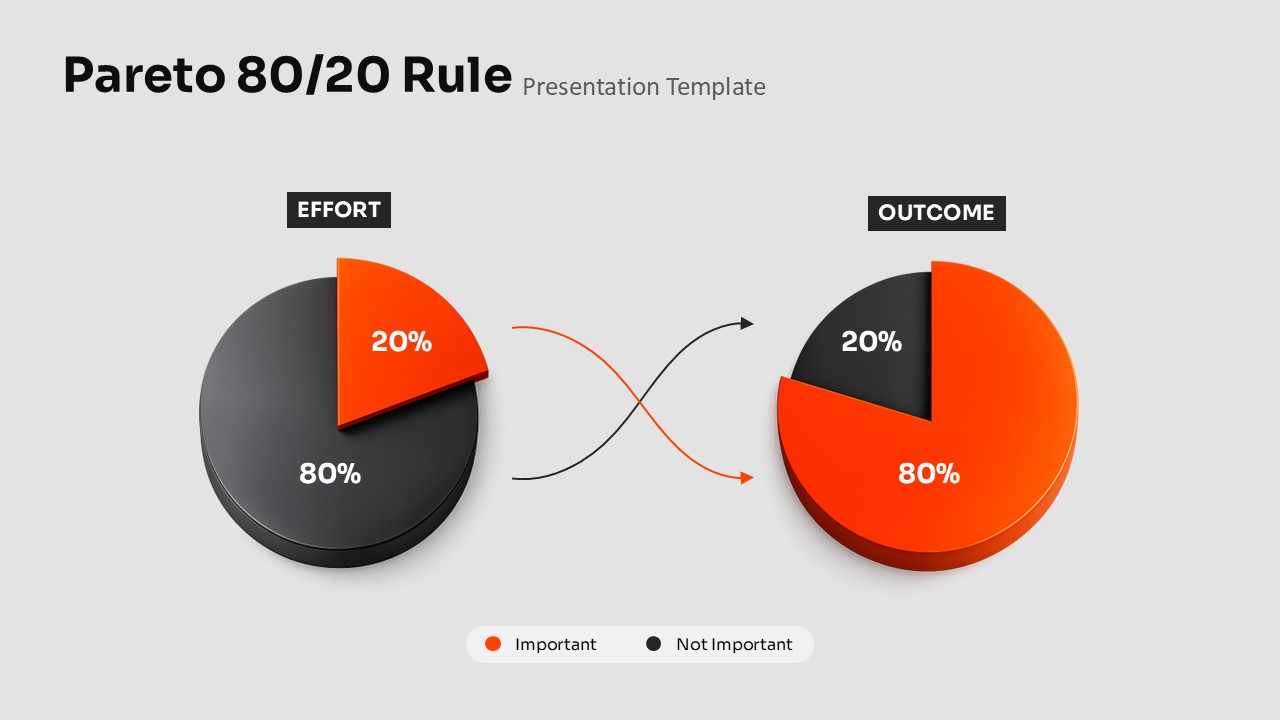
This professional presentation template brings the powerful Pareto Principle to life through stunning 3D visualization and clean, modern design. The template effectively demonstrates how 20% of efforts typically generate 80% of results, making it an essential tool for business strategy presentations, productivity training, and management discussions. With its comparative pie chart design and flowing arrow connections, this template helps audiences quickly grasp the critical concept of effort versus outcome distribution in any business context.
What’s Inside the Pareto 80/20 Template
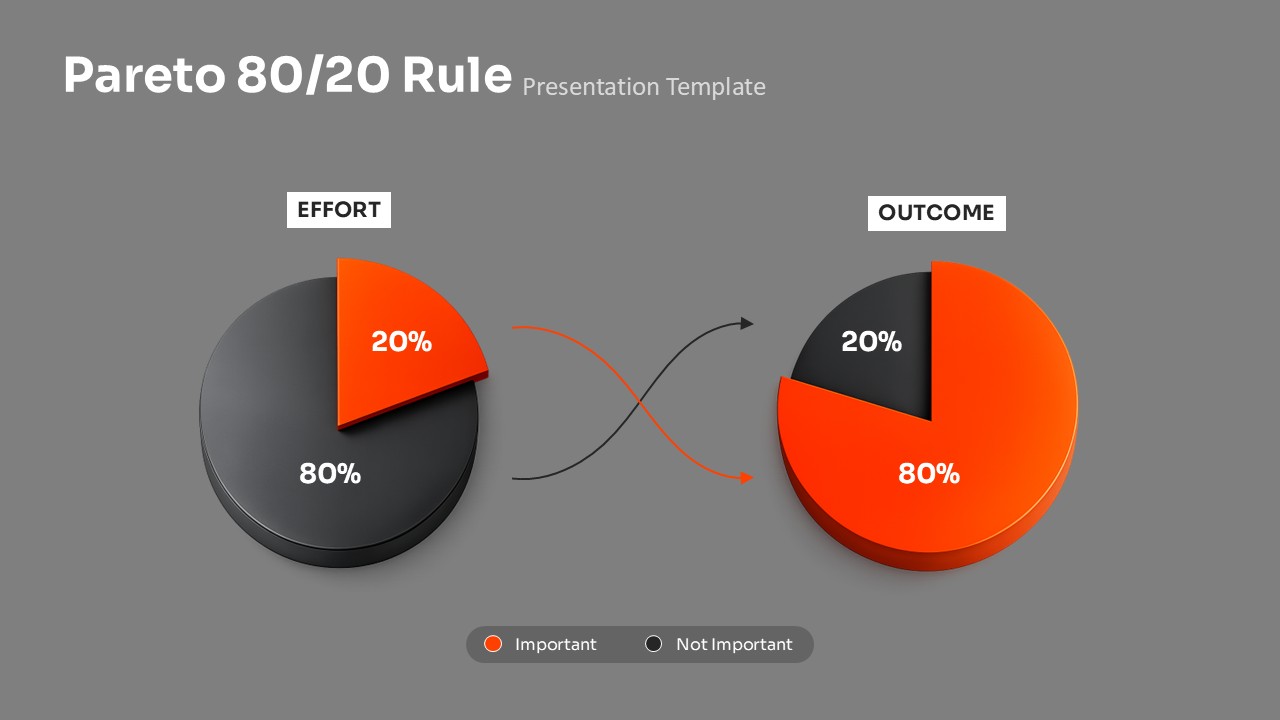
The template features two professionally designed slides with dual 3D pie charts showcasing effort and outcome distributions. Each chart displays clear percentage breakdowns with vibrant orange highlighting the critical 20% and 80% segments, while dark gray represents the remaining portions. Curved arrow connectors create a visual flow between the charts, emphasizing the relationship between input and results. The layout includes customizable title sections, chart headers, and a color-coded legend system that maintains consistency across both slide variations with light and dark background options.
Key Features of Pareto 80/20 Template
- Two professionally designed slides with light and dark background variations
- 3D pie charts with subtle shadows and depth effects
- Clear percentage labels and color-coded legend system
- Flowing arrow connectors showing cause-and-effect relationships
- Modern typography with clean, readable fonts
- Fully customizable colors, text, and chart elements
- Professional orange and gray color scheme
- Balanced composition with optimal white space utilization
Ideal For
This template serves business professionals, management consultants, team leaders, and trainers who need to communicate priority-setting concepts effectively. It’s particularly valuable for business strategy sessions, productivity workshops, resource allocation meetings, and performance analysis presentations. Project managers, executives, and educators will find this template essential for explaining focus principles, time management concepts, and strategic decision-making processes to teams and stakeholders.
Slide Highlights
The visual design features striking 3D pie charts with professional depth and shadow effects that create visual interest without overwhelming the content. The vibrant orange segments immediately draw attention to the critical 20% and 80% portions, while the dark charcoal gray provides excellent contrast. The curved connecting arrows guide the viewer’s eye naturally from effort to outcome, reinforcing the cause-and-effect relationship. Both background options maintain excellent readability, with the darker version offering a sophisticated alternative for corporate presentations.
Compatibility & Formats
This template is fully compatible with both PowerPoint and Google Slides, ensuring seamless editing across platforms. All elements including charts, text, colors, and graphics are completely customizable to match your brand requirements. The professional design maintains its quality and impact whether used in boardroom presentations or virtual meetings.
Login to download this file
What do you think of this template?
Category:
Business
Aspect Ratio: 16:9
Item ID: SPT0544
Color
Related Templates
-
Blue Ocean Strategy Canvas Infographic for PowerPoint & Google Slides
Business Strategy
-
-
-
-
-
-
MECE Principle Diagram Template for PowerPoint & Google Slides
Business Strategy
-
-
-
-
-
STEEPLE Analysis Framework Infographic for PowerPoint & Google Slides
Business Strategy


