Cause And Effect Diagram Google Slides & PowerPoint Template

Product Description
Cause And Effect Diagram Presentation Slide
This professional cause and effect diagram template features the classic fishbone structure designed for systematic root cause analysis and problem-solving presentations. With its clean, modern design and comprehensive 6M framework layout, this template provides an effective visual tool for identifying and organizing potential causes of problems or effects. The template is completely editable in both Microsoft PowerPoint and Google Slides, allowing you to customize all text, colors, and elements to match your specific analysis needs and corporate branding requirements.
What’s Inside the Cause And Effect Diagram Template
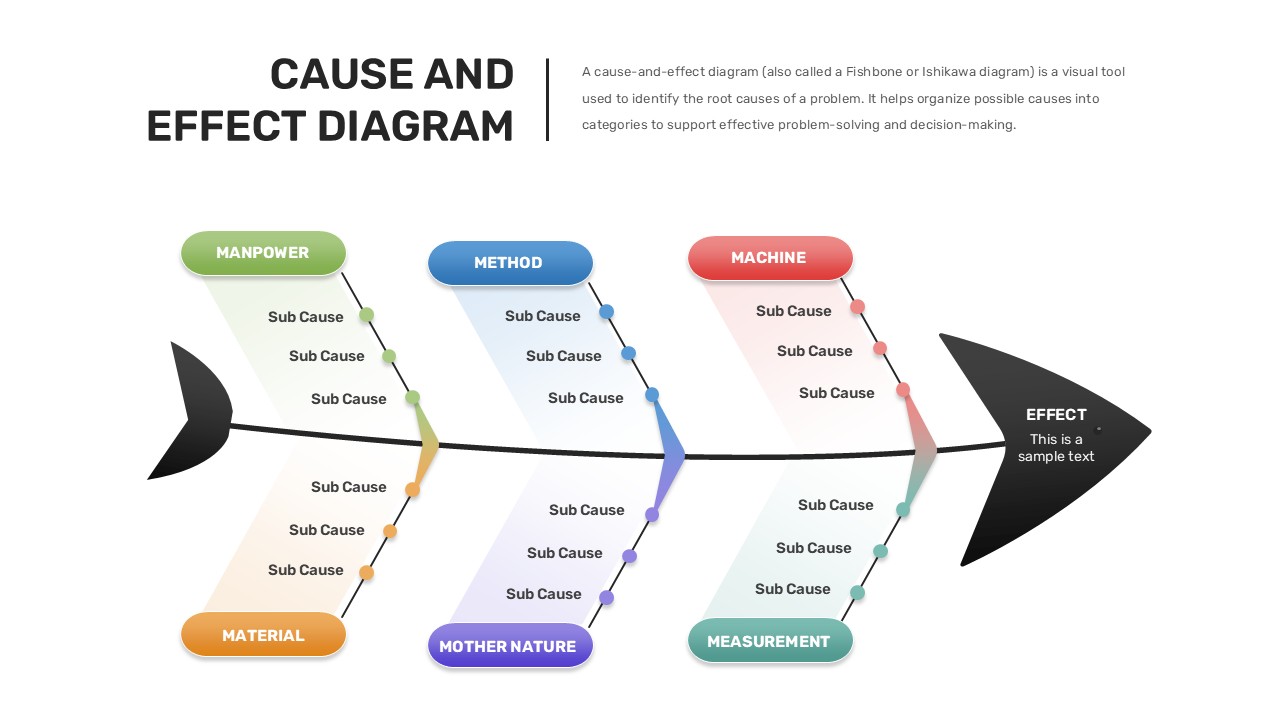
This template package includes two professionally designed slides featuring the traditional fishbone diagram structure with six main category branches extending from a central spine. Each branch contains multiple sub-cause text placeholders arranged in a hierarchical format, providing space for detailed cause identification. The design incorporates vibrant, distinct colors for each of the six main categories (Manpower, Method, Machine, Material, Mother Nature, Measurement), with both light and dark theme variations included. The layout maintains perfect symmetry with three branches above and three below the main spine, culminating in a clearly defined effect section.
Key Features of Cause And Effect Diagram Template
- Classic fishbone/Ishikawa diagram structure with six main cause categories
- 18 editable sub-cause text placeholders for detailed analysis
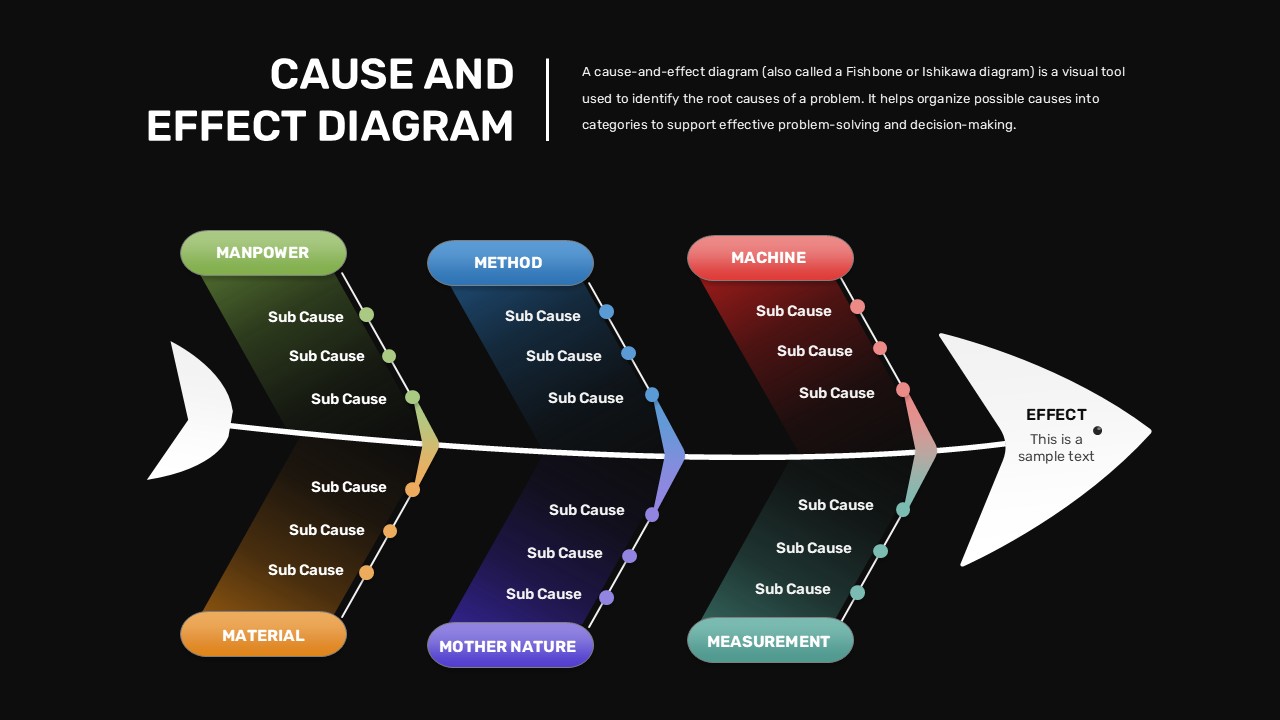
- Both light and dark theme variations included
- Vibrant color coding system for easy category identification
- Professional gradient design with high contrast readability
- Fully customizable text, colors, and layout elements
- 16:9 aspect ratio optimized for modern presentation displays
- Compatible with both PowerPoint and Google Slides platforms
Ideal For
This template is perfect for quality managers, process improvement specialists, Six Sigma practitioners, and team leaders conducting root cause analysis sessions. It serves manufacturing professionals, healthcare administrators, service industry managers, and consulting professionals who need to systematically identify and categorize problem causes. The template is also valuable for training facilitators teaching quality management methodologies, project managers addressing process issues, and business analysts presenting systematic problem-solving approaches to stakeholders and executive teams.
Slide Highlights
The template showcases a sophisticated color palette featuring green for Manpower, blue for Method, red coral for Machine, orange for Material, purple for Mother Nature, and teal for Measurement categories. The fishbone structure flows seamlessly from left to right with diagonal branches creating visual hierarchy and logical information flow. The dark theme variation offers deeper, more saturated colors against a black background, while the light theme provides crisp visibility with vibrant colors on white. Clean typography and strategic use of shapes enhance the professional appearance and ensure excellent readability during presentations.
Compatibility & Formats
This cause and effect diagram template is fully compatible with Microsoft PowerPoint and Google Slides, ensuring seamless editing and presentation capabilities across different platforms. All elements including text, colors, shapes, and layout components are completely editable, allowing for easy customization to match your specific analysis requirements and brand guidelines while maintaining professional quality standards.
Frequently Asked Questions
How do I customize the cause categories in this fishbone diagram template?
Simply click on any of the six main category headers (Manpower, Method, Machine, Material, Mother Nature, Measurement) and replace them with your specific cause categories. You can also change the colors of each branch by selecting the shapes and applying your preferred color scheme to match your analysis needs or corporate branding.
Can I add more sub-cause boxes to each branch of the diagram?
Yes, you can easily duplicate existing sub-cause text boxes by copying and pasting them, then repositioning as needed. The template structure is fully flexible, allowing you to add or remove sub-causes based on the complexity of your root cause analysis while maintaining the professional fishbone layout.
Is this template suitable for different types of problem-solving beyond manufacturing?
Absolutely. While the template includes the traditional 6M categories commonly used in manufacturing, you can customize all category names to fit any industry or problem type. This makes it perfect for healthcare, service industries, IT troubleshooting, project management issues, or any systematic problem-solving scenario.
Login to download this file
What do you think of this template?
Category:
Consulting
Aspect Ratio: 16:9
Item ID: SPT0574
Color
Related Templates
-
-
-
-
Harvey Balls Google Slides & PowerPoint Template
Business Strategy
-
-
Puzzle Piece PowerPoint & Google Slides Template
Business Strategy
-
-
-
-
Organization Challenges Hub Diagram PowerPoint & Google Slides Template
Business Strategy
-
-
Cost Benefit Analysis Matrix Google Slides & PowerPoint Template
Business Strategy


