Blue Ocean Strategy Canvas Infographic for PowerPoint & Google Slides
Product Description
Overview
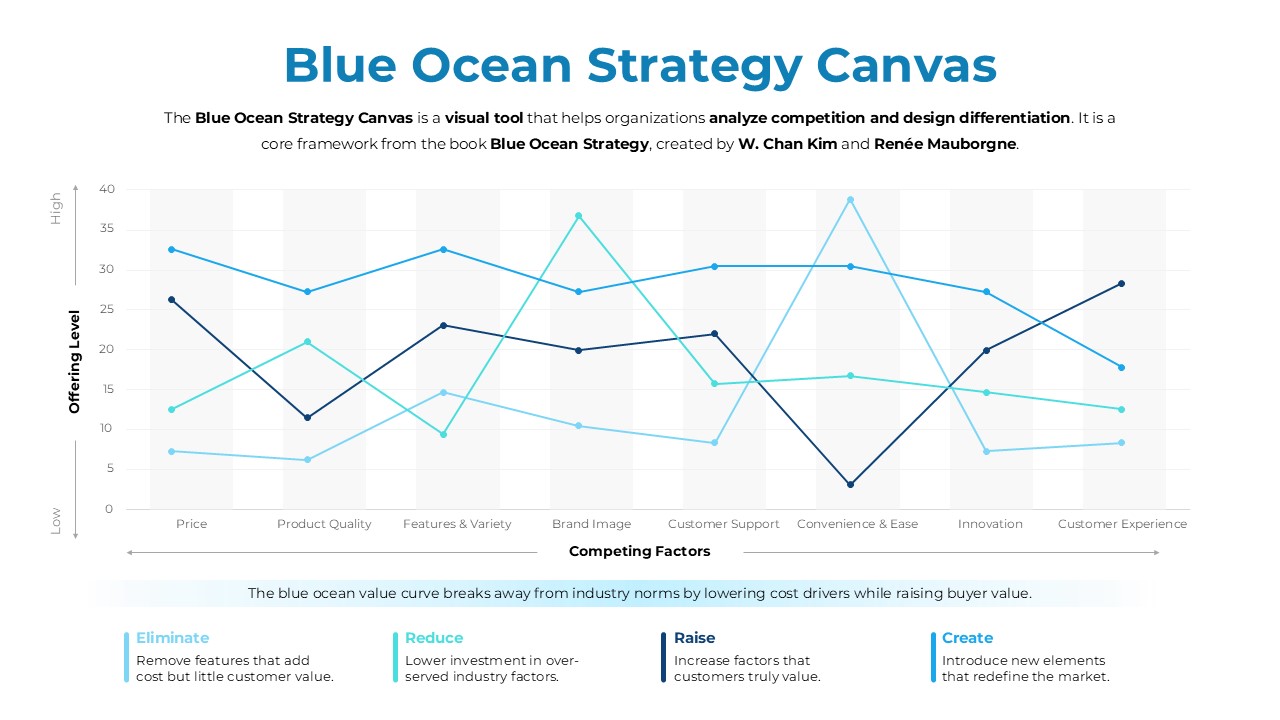
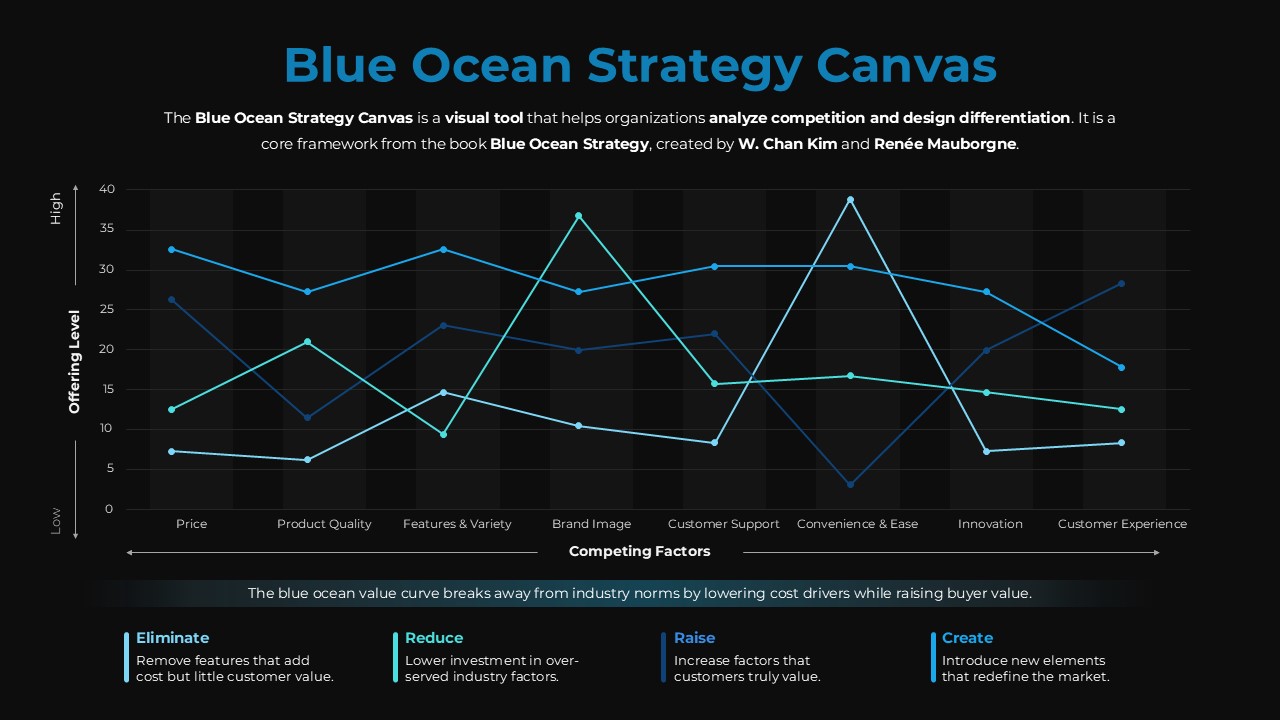
This Blue Ocean Strategy Canvas is designed to help visualize competitive positioning and value innovation. It is a fully editable presentation template, compatible with PowerPoint and Google Slides. The template focuses on comparing competing factors and highlighting differentiation opportunities through a clear value curve. It supports strategic thinking by simplifying complex market data into an easy to understand visual format. The layout is professional and data focused, making it suitable for executive level discussions.
What’s Inside the Template
The template includes a single detailed canvas slide featuring a multi line chart mapped across key competing factors. The horizontal axis presents factors such as price, quality, innovation, and customer experience, while the vertical axis represents offering levels. Multiple value curves allow comparison between competitors or strategic scenarios. Supporting text areas explain the Blue Ocean logic and include the eliminate, reduce, raise, and create framework for deeper strategic analysis.
Key Features
- Fully editable Blue Ocean Strategy Canvas layout
- Multi line chart for competitor and strategy comparison
- Clearly labeled competing factors and offering levels
- Integrated eliminate, reduce, raise, and create framework
- Clean infographic style suitable for strategic presentations
Ideal For
This template is ideal for strategy teams, consultants, business leaders, startups, and MBA students. It is well suited for market analysis, innovation workshops, competitive reviews, and strategic planning sessions. The canvas helps organizations communicate differentiation strategies clearly to stakeholders and decision makers.
Slide Highlights
The core highlight is the visual value curve that instantly shows how strategies diverge from industry norms. The balanced spacing keeps complex data readable, while subtle grid lines support accurate comparison. The inclusion of strategic guidance text reinforces correct use of the Blue Ocean methodology within presentations.
Compatibility & Formats
This template is fully compatible with PowerPoint and Google Slides. All chart data, labels, and colors are editable directly within the platform. The slide maintains formatting consistency across devices and requires no external tools or plugins.
Login to download this file
What do you think of this template?
Category:
Business Strategy
Aspect Ratio: 16:9
Item ID: SPT0348
Color
Related Templates
-
-
-
-
STEEPLE Analysis Framework Infographic for PowerPoint & Google Slides
Business Strategy
-
-
-
-
-
-
-
-


