Cause and Effect Infographic Template for PowerPoint & Google Slides


Product Description
Description
This template is designed to visually explain cause and effect relationships in a clear and logical format. It is a fully editable presentation template, compatible with PowerPoint and Google Slides.
It helps users illustrate how specific causes lead to measurable outcomes.
The layout emphasizes clarity, flow, and analytical thinking.
This template is ideal for breaking down complex problems into understandable components. By combining a circular process graphic with clearly separated cause and effect sections, it supports structured analysis and storytelling. The professional infographic style makes it suitable for both strategic discussions and educational explanations.
What’s Inside the Template
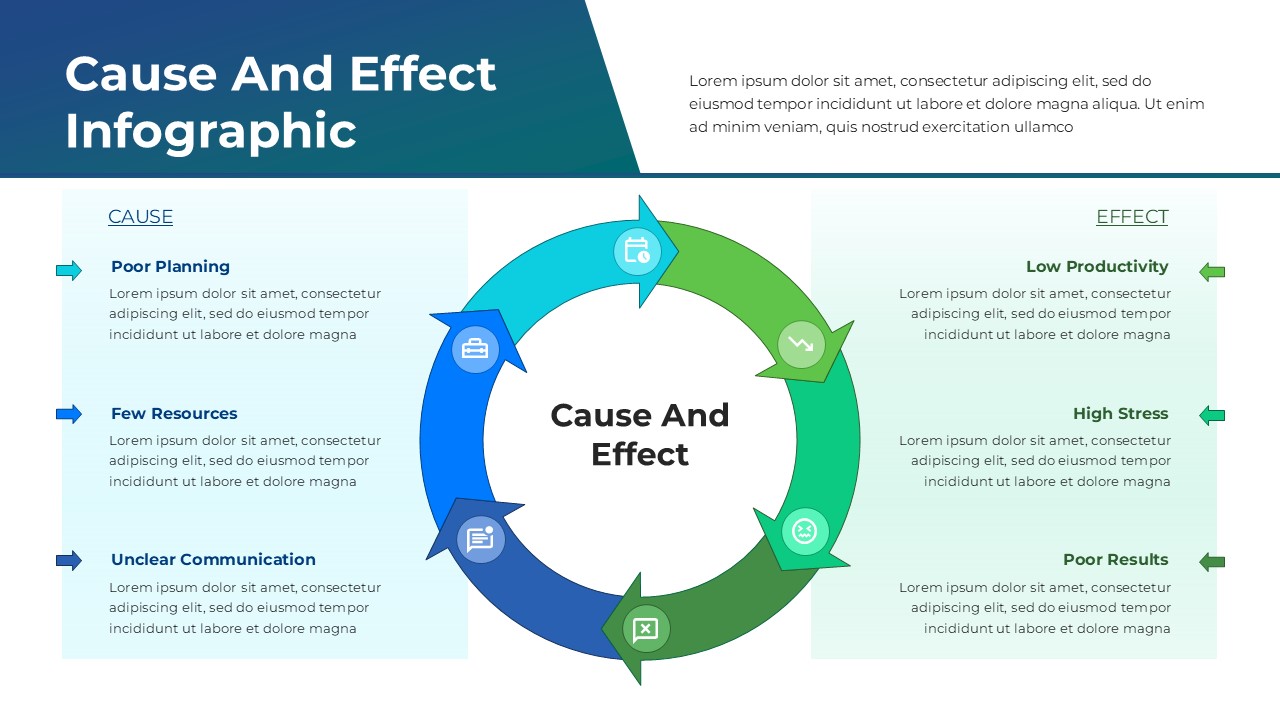
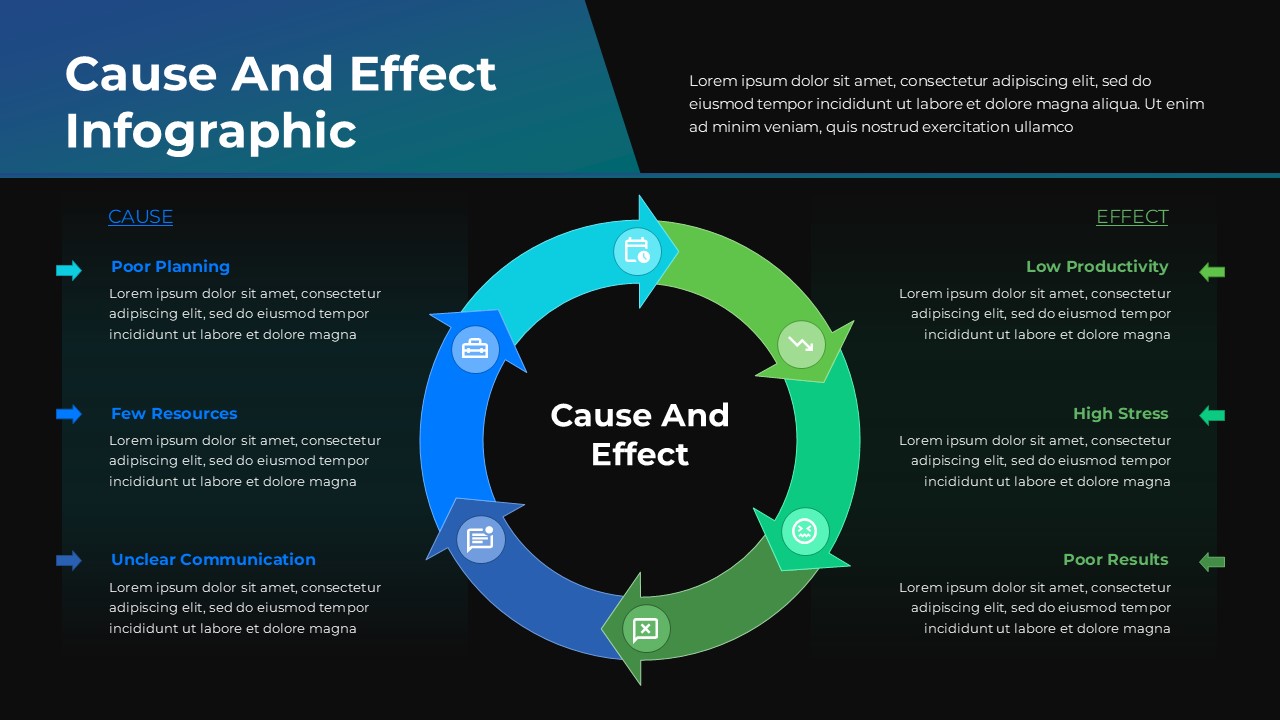
The template includes a central circular infographic that represents the ongoing relationship between causes and effects. On one side, a dedicated section highlights multiple causes with titles and supporting descriptions, such as planning gaps, limited resources, or communication issues. On the opposite side, corresponding effects are presented with equal emphasis, allowing audiences to easily connect inputs to outcomes. The circular arrows reinforce the idea of continuity and impact over time.
Key Features
- Circular cause and effect infographic layout
- Clear separation between cause and effect sections
- Visual arrows showing relationships and flow
- Balanced design for analytical presentations
- Suitable for problem analysis and root cause discussions
- Fully editable in PowerPoint and Google Slides
Ideal For
This template is ideal for business analysts, managers, consultants, educators, and students. It works well for root cause analysis, performance reviews, operational assessments, training sessions, and strategy presentations. Teams can also use it to explain challenges and outcomes during reviews or workshops.
Slide Highlights
The slide highlights a clean circular diagram at the center that visually connects all elements. Color coded arrows guide attention smoothly around the cycle, while side panels keep text organized and readable. The balanced composition ensures that both causes and effects receive equal focus without clutter.
Compatibility & Formats
The template is fully compatible with Microsoft PowerPoint and Google Slides. All infographic elements, text blocks, and colors are editable, allowing easy customization across platforms. It is optimized for widescreen formats and works well for both live presentations and shared documents.
Login to download this file
What do you think of this template?
Category:
Business
Aspect Ratio: 16:9
Item ID: SPT0277
Color


