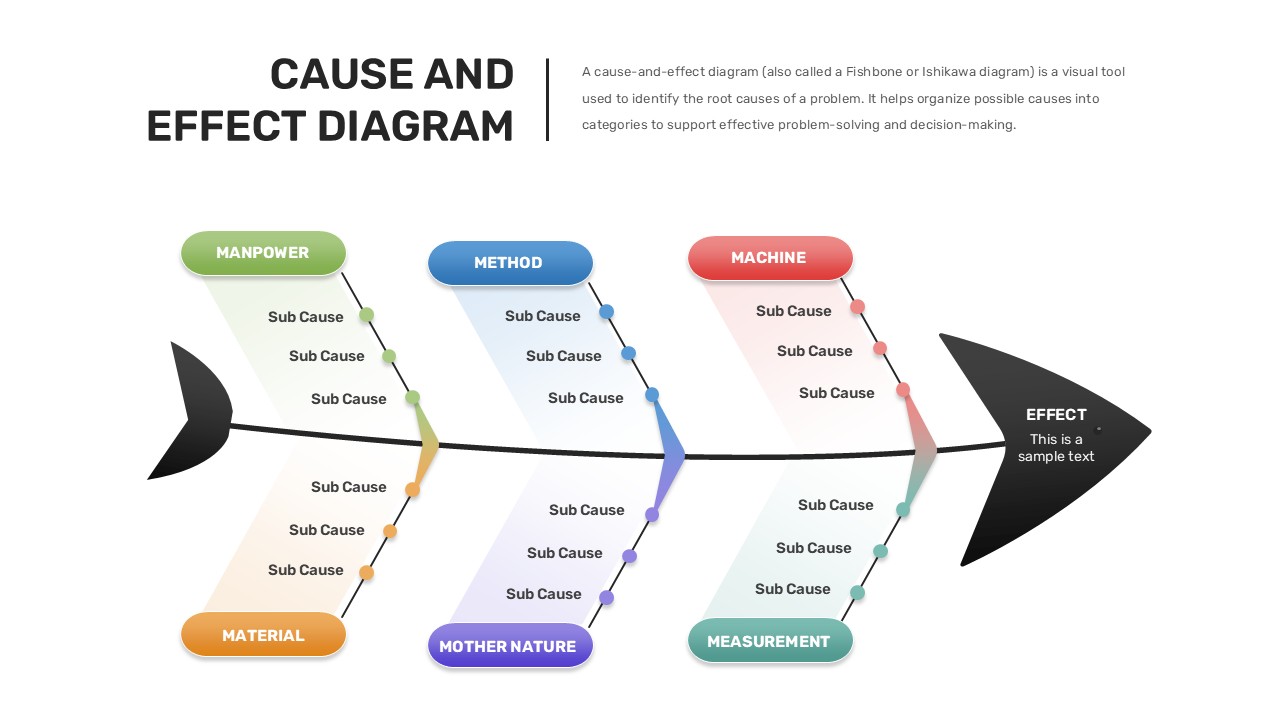
This is slide 1 of the Cause And Effect Diagram template, featuring a classic fishbone/Ishikawa diagram on a light background. The template displays six main cause categories (Manpower, Method, Machine, Material, Mother Nature, Measurement) in vibrant colors – green, blue, red, orange, purple, and teal. Each category branch contains multiple sub-cause text boxes, with the effect section positioned on the right. The design includes editable placeholder text and is fully compatible with PowerPoint and Google Slides for quality management and root cause analysis presentations.