China Map Template for PowerPoint & Google Slides


Product Description
Description
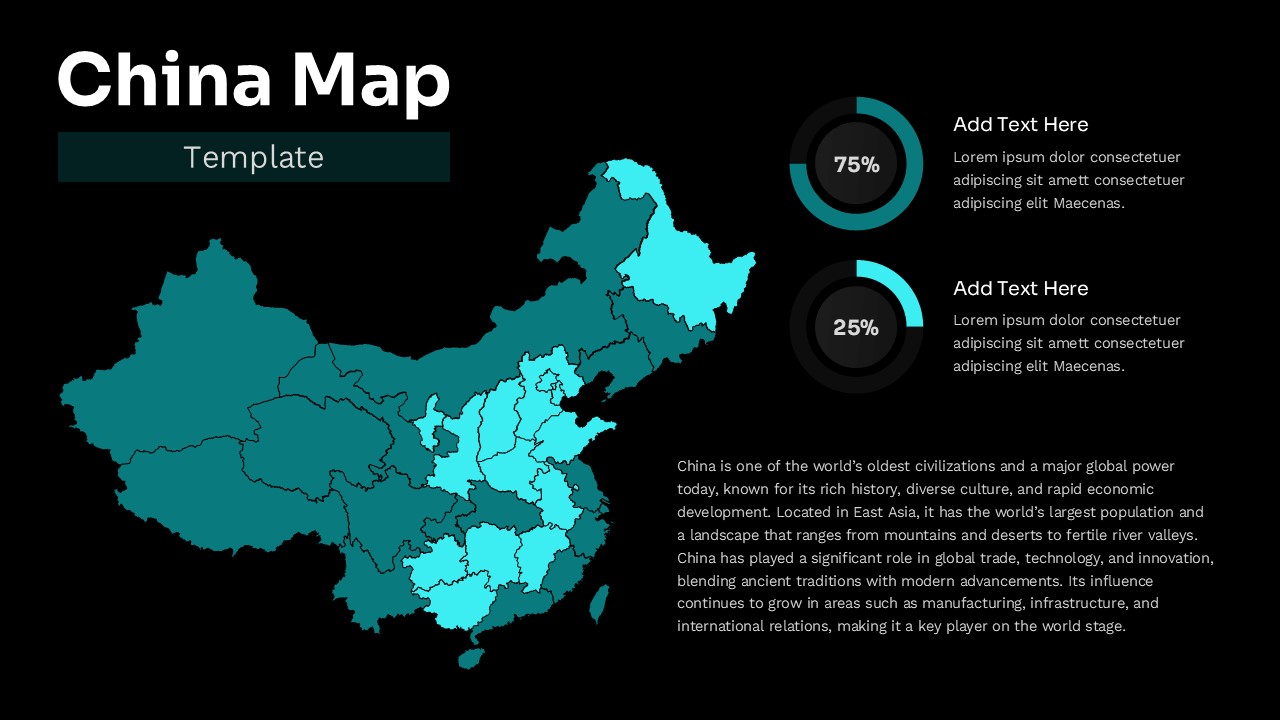
This China map presentation is designed to visualize geographic, regional, and statistical data across provinces in a clear and professional format. It is a fully editable presentation template compatible with PowerPoint and Google Slides. The layout supports regional comparison, percentage based insights, and location driven storytelling for business, education, and research use. Built with clean vector shapes, the template allows precise customization without design complexity.
The map centered structure makes it ideal for presenting demographic trends, market distribution, operational coverage, or economic indicators across China. Color coded regions and integrated data visuals ensure your message remains clear and visually consistent.
What’s Inside the Template
The template includes a detailed China map with clearly separated provincial boundaries, enabling accurate regional emphasis. Accompanying the map are circular percentage charts designed to display key metrics such as growth share, market penetration, or population ratios. Text placeholders are positioned strategically to support concise explanations without overcrowding the slide. All elements are editable, allowing users to adjust colors, values, labels, and descriptions to align with specific presentation goals.
Key Features
- Fully editable China map with province level segmentation
- Vector based shapes for smooth scaling and clarity
- Integrated percentage donut charts for quick data comparison
- Clean layout suitable for professional and academic use
- Easy color customization for regional highlighting
- Works seamlessly in PowerPoint and Google Slides
Ideal For
This template is well suited for business analysts, consultants, educators, researchers, and corporate teams who need to present China focused data clearly. It works effectively for market analysis, geographic reporting, regional performance reviews, academic presentations, and policy or infrastructure overviews where spatial clarity is essential.
Slide Highlights
The central highlight is the large China map that immediately anchors attention and provides geographic context. Color differentiation across regions supports comparison at a glance, while the circular data charts add a quantitative layer without distracting from the map. Balanced spacing between visuals and text ensures readability even when presenting complex regional insights.
Compatibility & Formats
The template is fully compatible with Microsoft PowerPoint and Google Slides. All slides use standard fonts and editable vector elements, ensuring consistent appearance across devices and platforms without requiring additional software.
Login to download this file
What do you think of this template?
Category:
Business
Aspect Ratio: 16:9
Item ID: SPT0246
Color
Related Templates
-
-
-
-
-
-
-
-
-
-
Editable Germany Map for PowerPoint & Google Slides
Infographics
-
-


