Climate Change Infographic Template for PowerPoint & Google Slides
Product Description
Description
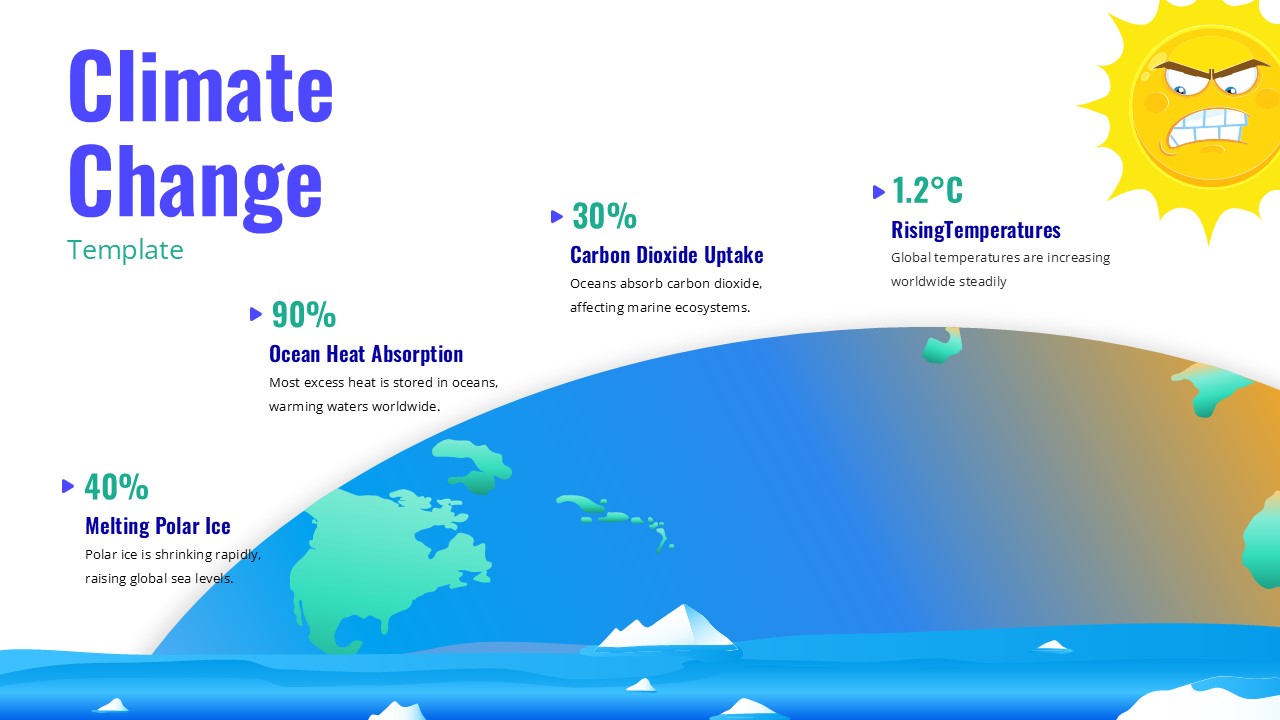
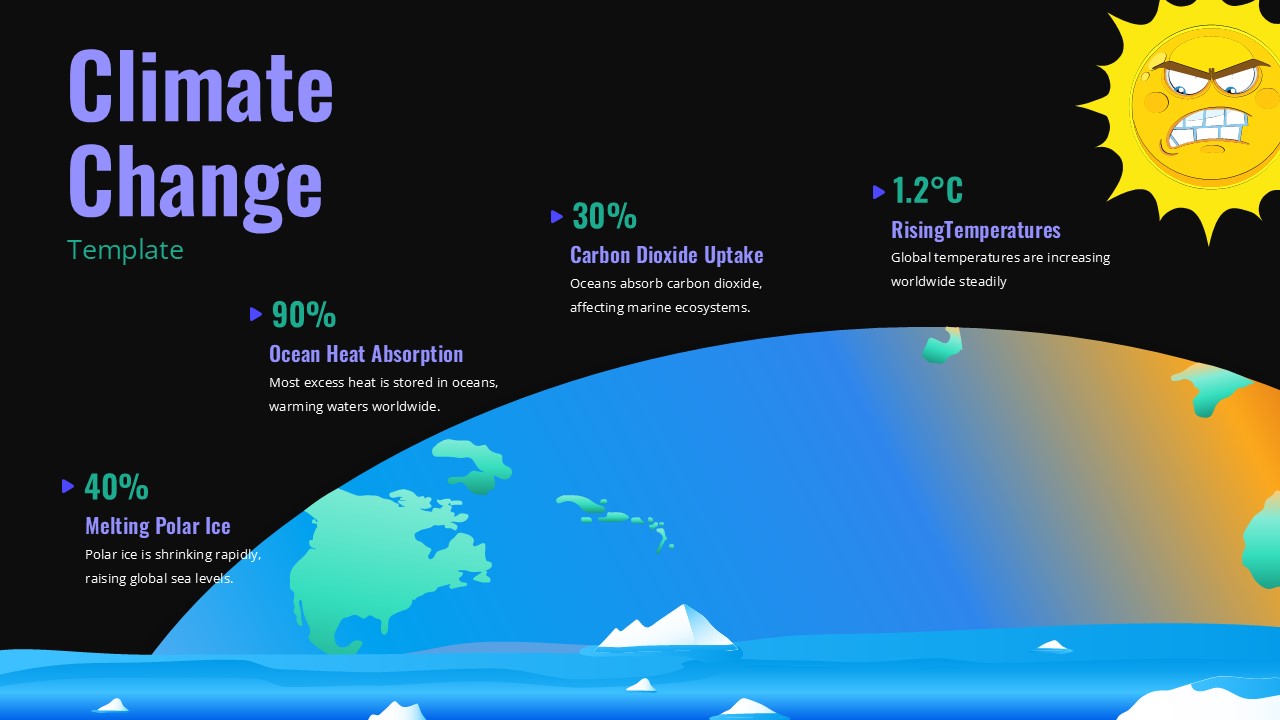
This climate change infographic is designed to present key environmental facts and global warming impacts in a clear visual format. It is a fully editable presentation template compatible with PowerPoint and Google Slides. The slide combines data driven insights with engaging illustrations to communicate complex climate information effectively.
It helps audiences quickly understand major climate indicators and environmental trends.
All elements are customizable to fit educational, research, or awareness focused presentations.
What’s Inside the Template
The template features a single infographic style slide with a strong visual narrative. It includes a large illustrated globe, ocean and ice visuals, and multiple data callouts highlighting climate indicators such as rising temperatures, carbon dioxide absorption, ocean heat storage, and polar ice melt. Text placeholders are clearly positioned to support statistics and short explanations, making the slide easy to adapt for different audiences and presentation goals.
Key Features
- Climate change infographic slide layout
- Clear data callouts with percentage and metric highlights
- Engaging earth, ocean, and ice illustrations
- Balanced mix of visuals and text areas
- Fully editable text, colors, and shapes
- Suitable for presentations and reports
Ideal For
This template is ideal for educators, students, environmental organizations, researchers, and policy presenters. It works well for classroom lessons, sustainability reports, awareness campaigns, and environmental conferences. The visual storytelling approach makes it suitable for both academic and public facing presentations.
Slide Highlights
The slide highlights include a visually engaging earth illustration paired with concise climate statistics. Percentage based insights and temperature indicators are clearly separated for easy reading. The layout guides the viewer naturally across the slide, reinforcing the relationship between global warming, ocean impact, and polar ice changes in a single cohesive visual.
Compatibility & Formats
This presentation template is fully compatible with Microsoft PowerPoint and Google Slides. All elements are editable directly within the software without additional tools. The slide maintains visual consistency across devices and screen sizes.
Login to download this file
What do you think of this template?
Category:
Education
Aspect Ratio: 16:9
Item ID: SPT0281
Color


