Cohort Analysis Chart Google Slides & PowerPoint Template


Product Description
Cohort Analysis Chart Presentation Template
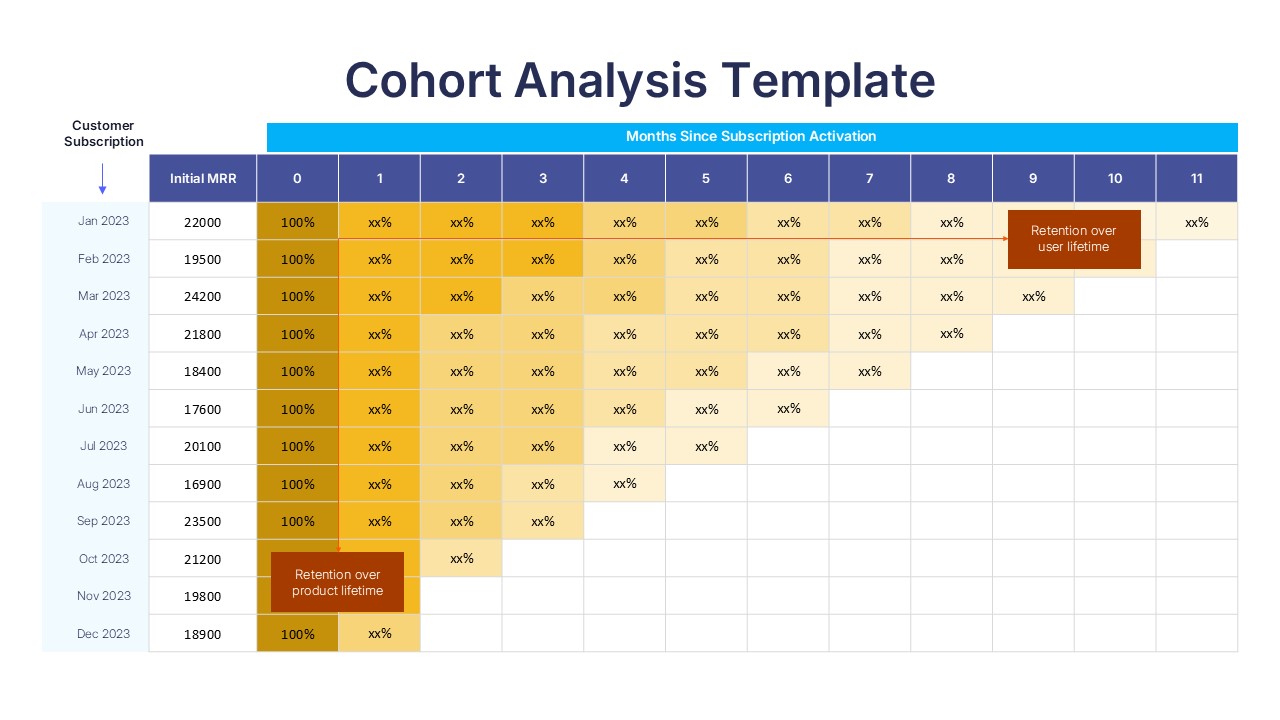
This comprehensive cohort analysis chart template provides a professional framework for tracking customer retention and subscription performance over time. Featuring a clean, data-focused design with both light and dark theme options, this template is completely editable in both Microsoft PowerPoint & Google Slides. The structured table layout makes it easy to visualize retention patterns, identify valuable customer segments, and present critical business metrics to stakeholders with clarity and impact.
What’s Inside the Cohort Analysis Chart Template
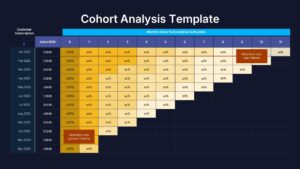
This 2-slide template features identical cohort analysis tables with different theme options to match your presentation needs. Each slide includes a triangular data structure showing customer subscription months from January to December 2023, initial MRR values ranging from $16,900 to $24,200, and retention tracking across 11 months post-activation. The design incorporates blue header rows, golden gradient percentage cells, and red accent annotations for lifetime retention milestones, all organized in a clear grid-based format that supports easy customization.
Key Features of Cohort Analysis Chart Template
- Dual theme design with light and dark background options
- Pre-structured cohort table for 12-month analysis period
- Editable MRR values and retention percentage placeholders
- Color-coded cells for easy data visualization and pattern recognition
- Professional typography optimized for data presentation clarity
- Triangular data layout following standard cohort analysis methodology
- Special annotation fields for retention milestone tracking
- High contrast design elements for maximum readability
Ideal For
This template is perfect for SaaS companies, subscription businesses, customer success teams, and data analysts who need to present retention metrics effectively. Marketing managers tracking customer lifecycle performance, executives presenting to investors, and business analysis professionals will find this template invaluable for communicating complex retention data. It’s also ideal for product managers monitoring customer satisfaction trends and finance teams analyzing recurring revenue patterns across different customer acquisition periods.
Slide Highlights
The template showcases a sophisticated color palette combining deep blue headers with warm golden gradients that visually represent retention percentages from high to low values. Red accent cells draw attention to critical lifetime retention metrics, while the clean grid structure ensures data remains highly readable. The dark theme variant maintains the same professional aesthetic with a navy background, creating versatility for different presentation contexts. Strategic use of white space and consistent cell sizing enhances the overall visual appeal while maintaining focus on the analytical content.
Compatibility & Formats
Fully compatible with both Microsoft PowerPoint and Google Slides, this template allows complete customization of all text, colors, and data elements. Every component is editable, enabling you to adapt the design to match your brand colors and specific data analysis requirements while maintaining professional presentation standards.
Frequently Asked Questions
Can I customize the time periods and cohort labels in this template?
Yes, all text elements including month labels, cohort periods, and MRR values are fully editable. You can easily modify the template to show different time ranges, quarters, or custom cohort groupings to match your specific analysis needs.
Does this template work for different types of subscription businesses?
Absolutely! While the template uses MRR examples, you can adapt it for any subscription model including SaaS, membership sites, subscription boxes, or service-based businesses. Simply replace the metrics with your relevant data points like customer count, revenue, or usage rates.
How do I choose between the light and dark theme versions?
The light theme works well for printed materials and traditional corporate presentations, while the dark theme is ideal for screen presentations, investor pitches, or when matching dark-themed brand guidelines. Both versions contain identical data structures and functionality.
Login to download this file
What do you think of this template?
Category:
Business
Aspect Ratio: 16:9
Item ID: SPT0578
Color
Related Templates
-
-
-
-
Pareto 80/20 Rule Chart PowerPoint & Google Slides Template
Charts & Graphs
-
-
-
-
-
-
-
Harvey Balls Google Slides & PowerPoint Template
Business Strategy
-
Pain Points Google Slides & PowerPoint Template
Business Analysis


