Free Pie Chart PowerPoint Template Dark
This template is part of a deck featuring multiple slides. To check out all slides.
See All
Product Description
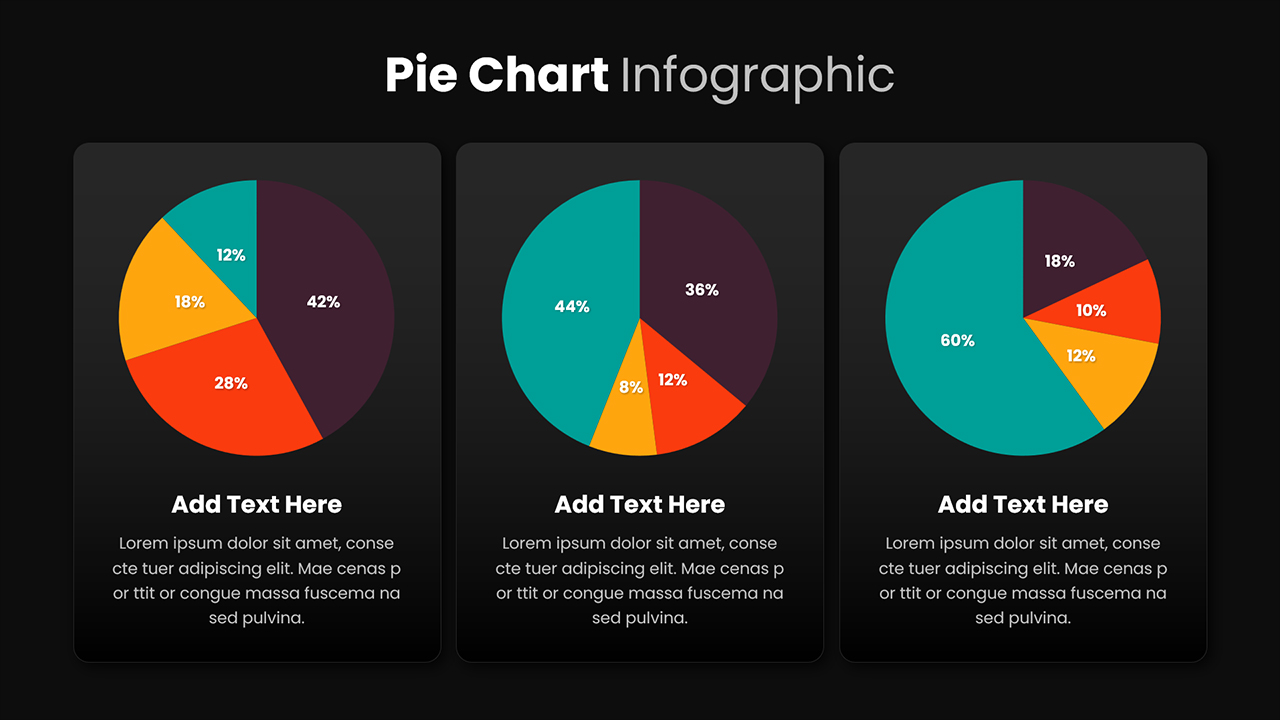
Visualize your data with clarity and precision using this Colorful Pie Chart Infographic Template for PowerPoint and Google Slides. The slide presents three neatly aligned pie charts, each featuring a multi-segment circular layout with editable percentage labels and customizable text areas. Designed for visual balance, the layout combines vibrant slices of teal, orange, red, yellow, and purple, ensuring clear differentiation between data categories. Rounded card backgrounds and subtle shadows create a professional yet approachable look suitable for both corporate and educational presentations.
This slide enables presenters to illustrate statistical comparisons, proportional data, and survey results in a digestible, visual form. Each chart block includes a headline placeholder and descriptive text field, making it easy to explain metrics or contextual insights. The flat, minimalist design style ensures that your content remains the focus, while the cohesive color palette enhances visual engagement. Perfectly optimized for modern presentation platforms, it maintains consistent formatting and sharp resolution across PowerPoint and Google Slides.
Beyond static reporting, this pie chart template supports animated transitions or data-driven chart updates. You can quickly adjust slice proportions, recolor segments to match your branding, or duplicate charts for multi-variable analysis. Whether you're presenting financial breakdowns, marketing shares, or performance ratios, this layout delivers clarity, adaptability, and professional polish.
Who is it for
Ideal for business analysts, marketers, educators, and consultants who need to present survey data, performance metrics, or financial breakdowns in an engaging, easy-to-understand format.
Other Uses
Repurpose this slide to depict market share comparisons, departmental budget allocations, product performance metrics, or academic research statistics. It also works well for dashboards, quarterly reports, and infographic-style summaries.
Login to download this file
What do you think of this template?
-
Category:
Pie chart -
-

-

File size: 16:9 (Widescreen)
-

Item ID: SPT0039
-

Color