Pie Chart PowerPoint Template Dark
This template is part of a deck featuring multiple slides. To check out all slides.
See All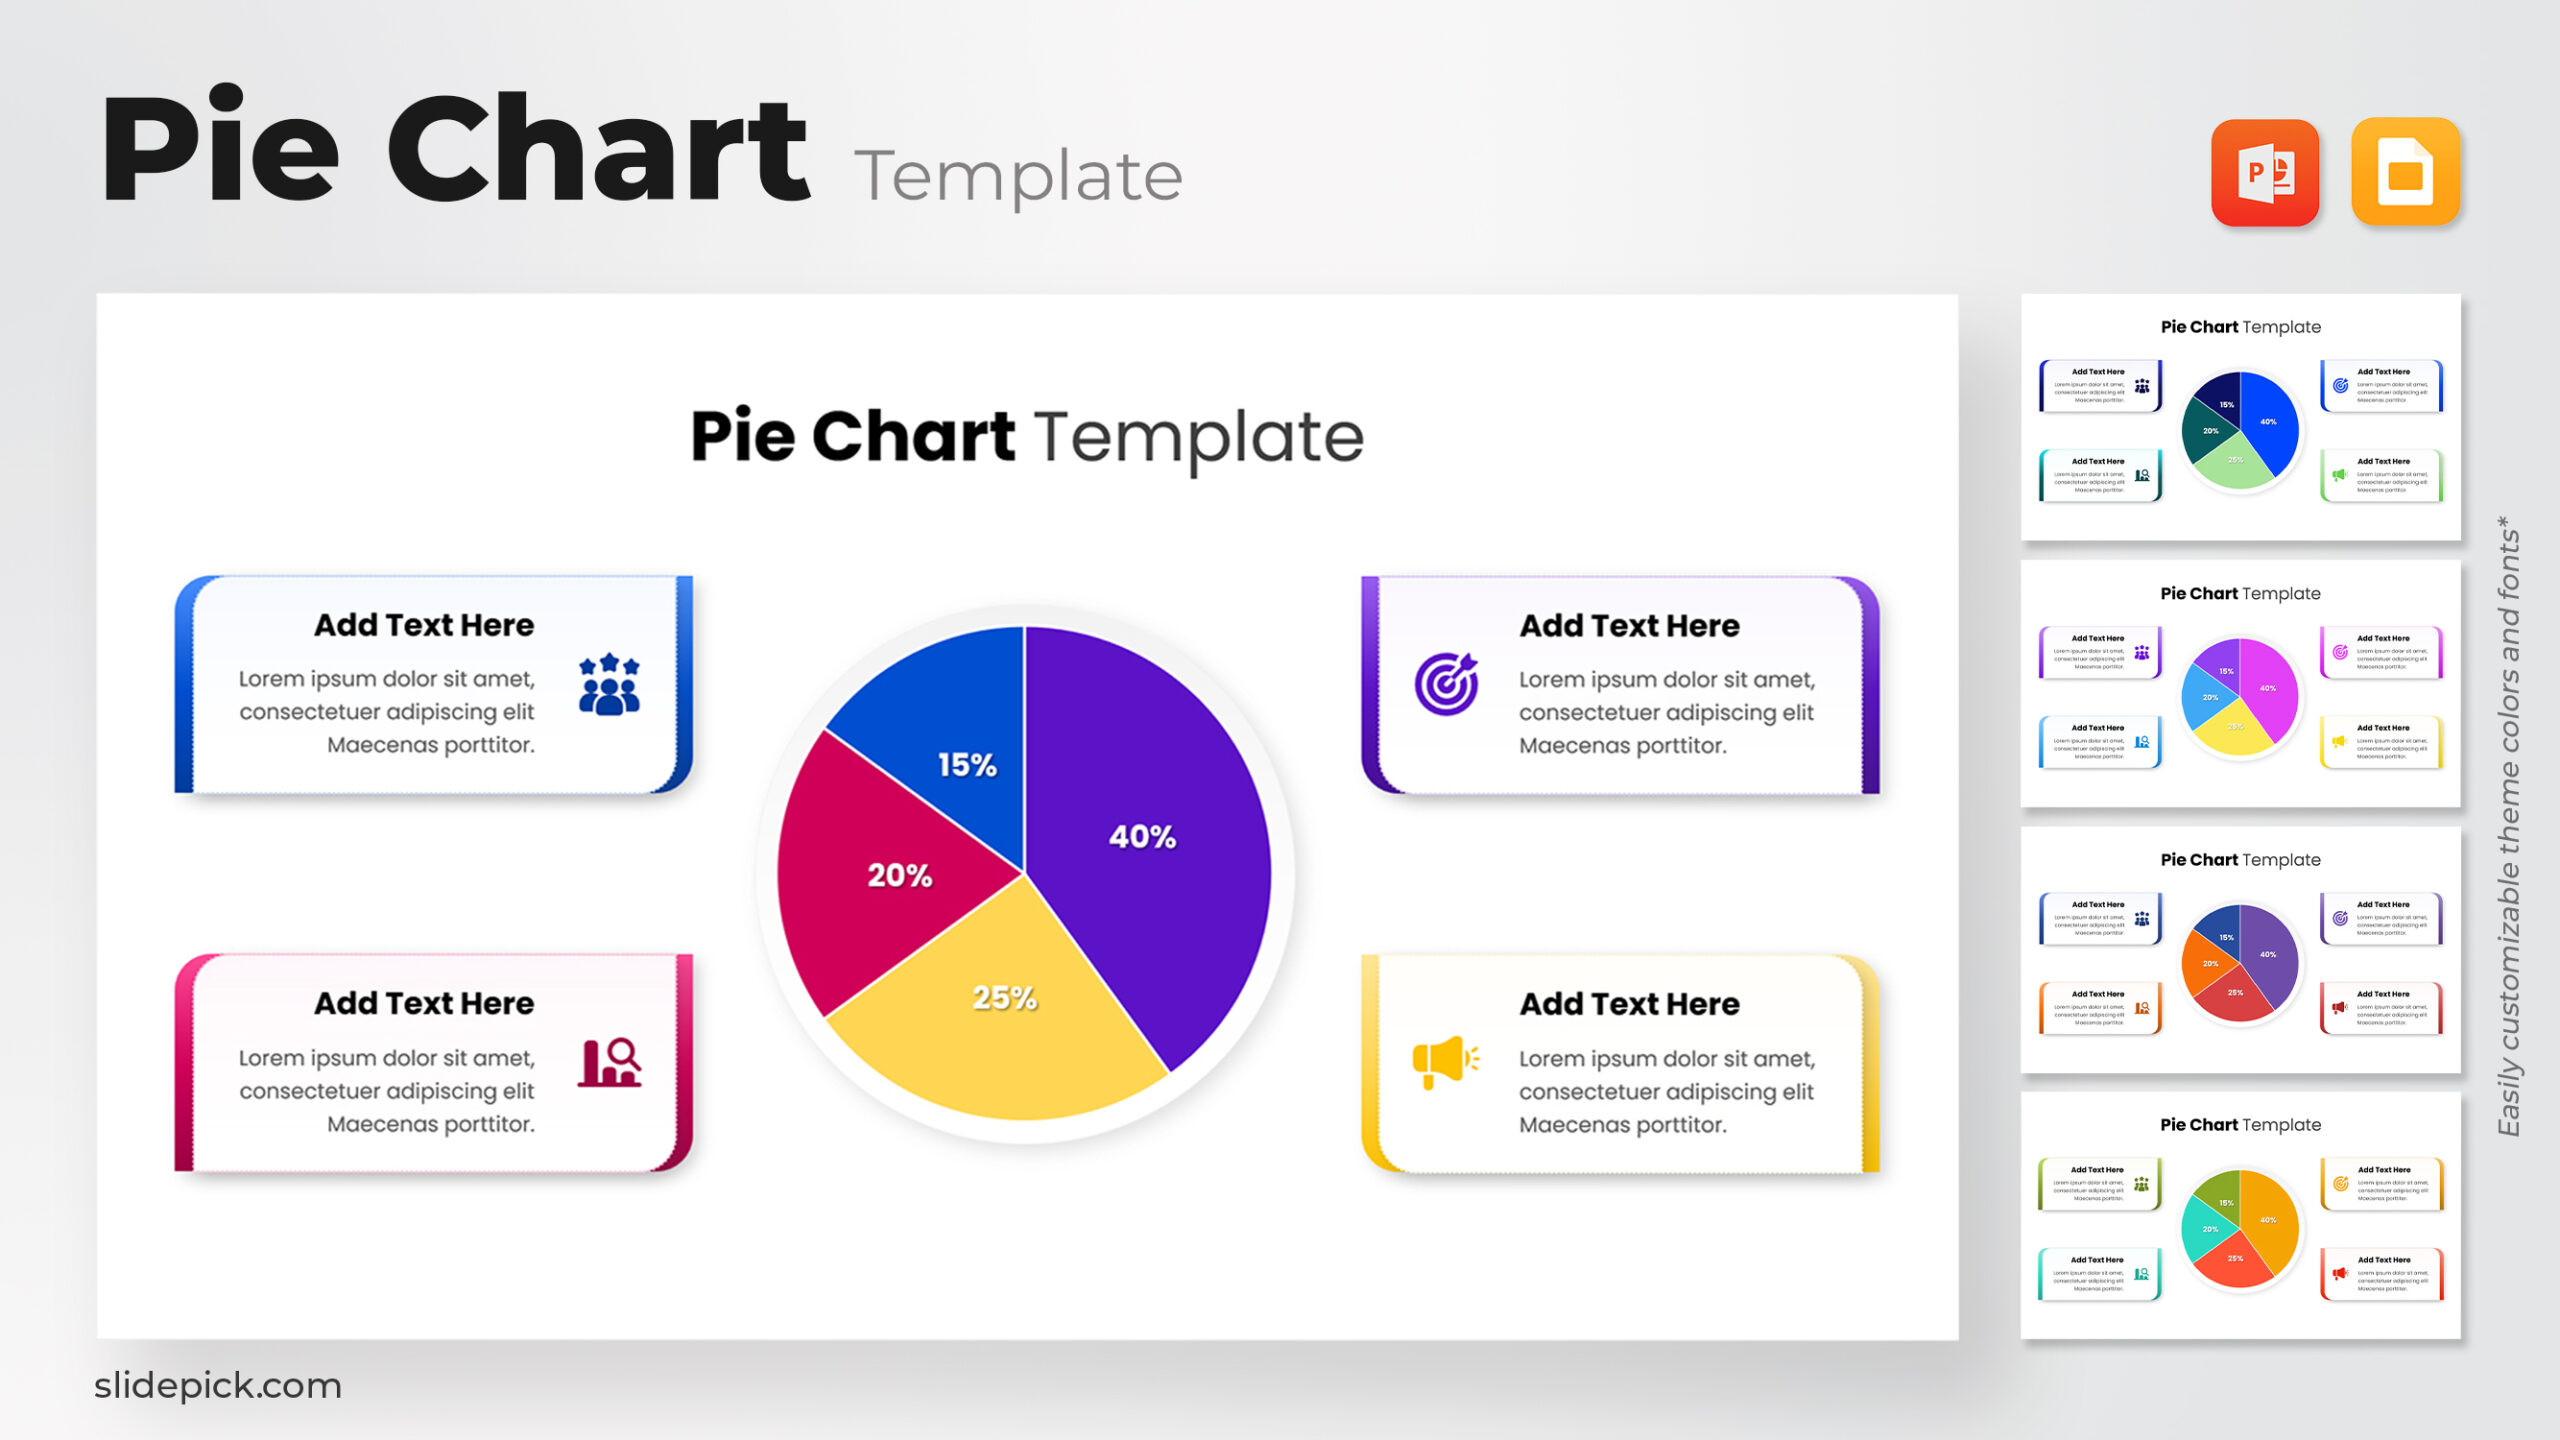
Product Description
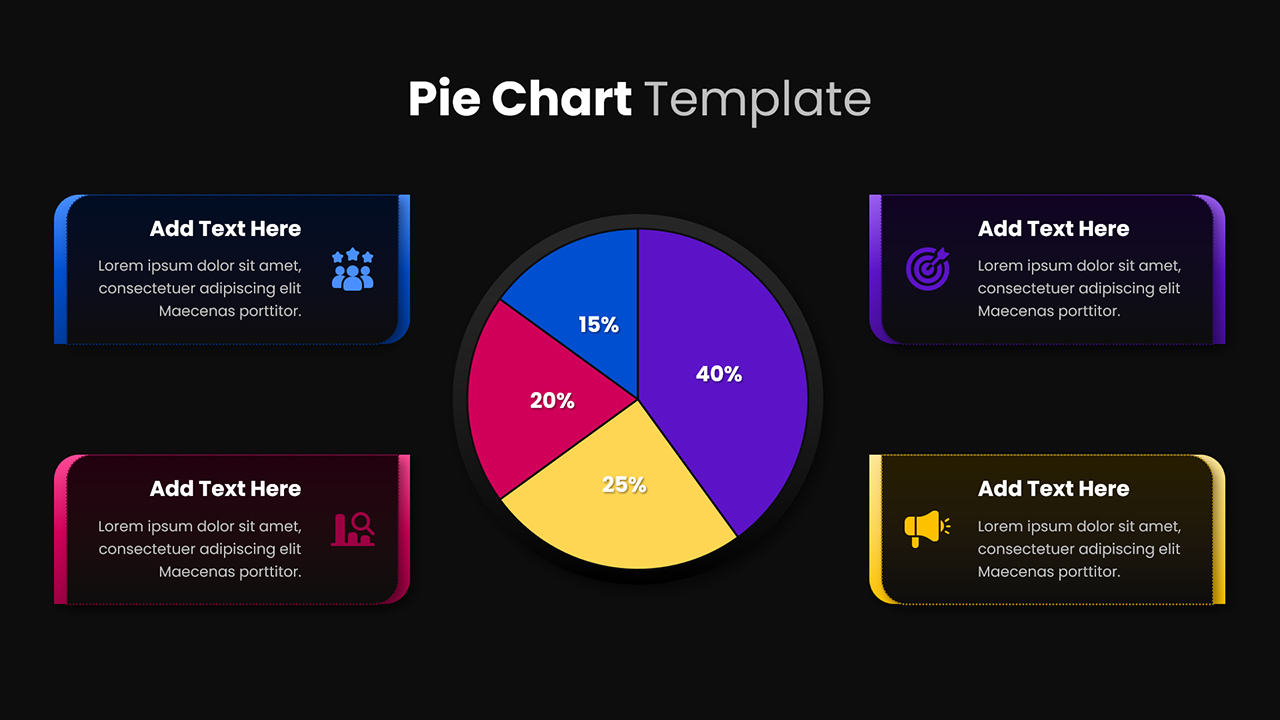
This colorful Pie Chart Data Visualization Template for PowerPoint and Google Slides is designed to help you communicate proportions, performance metrics, and categorical data with maximum clarity. At the center, a four-segment pie chart presents data values of 15%, 20%, 25%, and 40%, each represented by a distinct color—blue, red, yellow, and purple. Around the chart, four neatly placed text boxes include editable icons and descriptions, enabling you to annotate each data slice with insights, labels, or performance notes. The rounded rectangle callouts with gradient accents and subtle drop shadows create a clean, modern aesthetic that enhances data storytelling while keeping focus on the core chart.
Every element in this slide is fully editable—colors, icons, and text fields can be customized to match your presentation theme or corporate branding. The chart is built for easy percentage adjustments, ensuring accurate visual representation of any dataset. Whether used in a business meeting, marketing report, or analytics review, this slide supports quick comparisons and drives visual impact through a structured yet dynamic layout.
Optimized for seamless integration, this pie chart slide maintains perfect formatting in both PowerPoint and Google Slides. Its vector-based components guarantee high resolution on all screen sizes, making it ideal for professional and educational settings alike.
Who is it for
This pie chart template is ideal for marketing professionals, project managers, business analysts, educators, and consultants who regularly present statistical findings, survey results, or performance breakdowns.
Other Uses
Beyond business analysis, it can be adapted for financial summaries, customer segmentation, HR diversity reports, academic presentations, or product sales distribution visuals.
Login to download this file
What do you think of this template?
-
Category:
Pie chart -
-

-

File size: 16:9 (Widescreen)
-

Item ID: SPT0038
-

Color