Customer Journey Map Infographic Template for PowerPoint & Google Slides


Product Description
Description
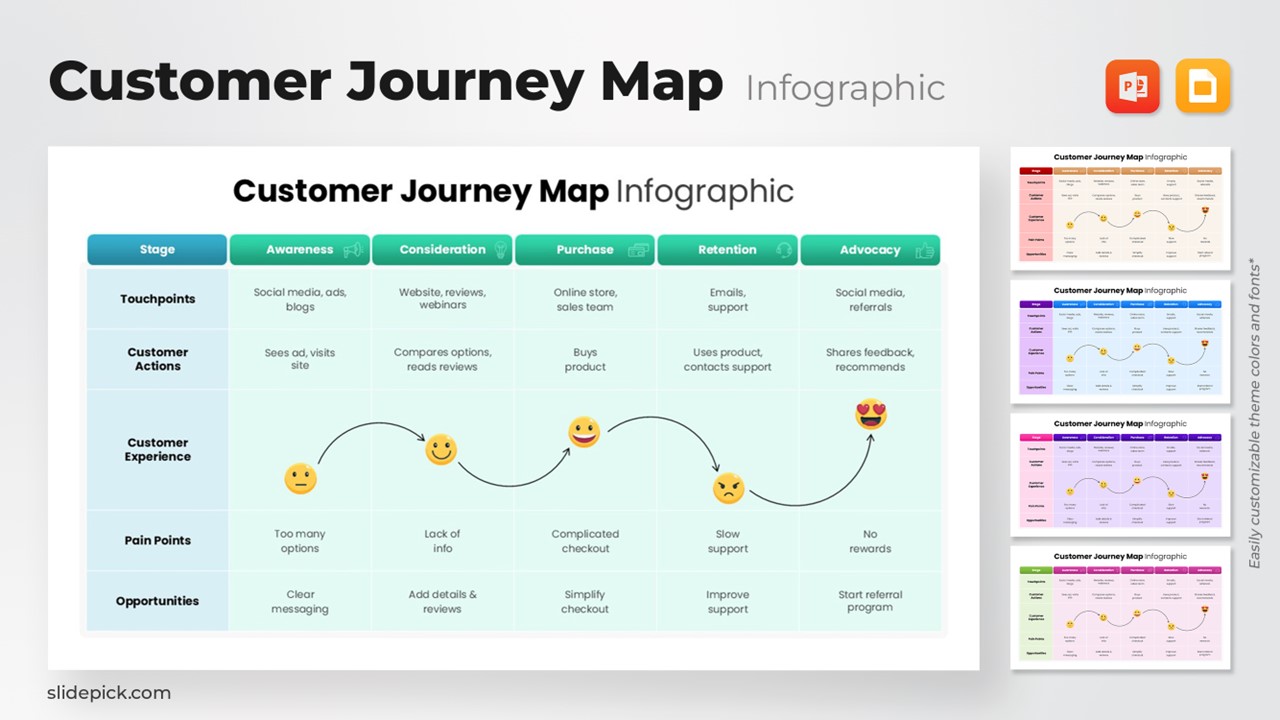
This Customer Journey Map Infographic template offers a clear and visually structured way to illustrate how customers move from awareness to advocacy. Designed with a clean grid layout and color-coded stages, it helps marketers, product teams, and customer-experience professionals present insights in a format that is both intuitive and executive-ready. The template breaks down each stage of the journey into touchpoints, actions, emotions, pain points, and opportunities, allowing teams to align on priorities and identify areas for improvement.
What’s Inside the Template
The template features a five-stage journey Awareness, Consideration, Purchase, Retention, and Advocacy displayed across a horizontal flow. Each column includes dedicated rows for touchpoints, customer actions, customer experience, pain points, and opportunities. Visual emoji indicators clearly depict emotional transitions throughout the journey. The structured layout makes it easy to compare stages side by side while offering enough flexibility to customize details for any industry or customer persona.
Key Features
- Fully editable layout optimized for clarity and storytelling
- Color-coded stage headers for quick interpretation
- Emotion pathway with icons to visualize satisfaction or frustration
- Organized row-by-row structure for consistent customer-journey mapping
- Designed for both presentation and strategic documentation
- Works seamlessly in PowerPoint and Google Slides
Ideal For
This template is suited for marketing teams, product managers, UX researchers, service designers, sales strategists, and customer-success leaders who need a professional, presentation-ready customer journey illustration. It is especially useful during workshops, CX audits, persona development sessions, and strategic planning meetings.
Slide Highlights
- Stage Overview Grid: A clean matrix that aligns the entire journey from awareness through advocacy.
- Touchpoint Mapping: Shows where customers interact with your brand across digital and human channels.
- Emotion Curve: Uses expressive icons to depict sentiment shifts at each stage.
- Pain Points & Opportunities: Helps identify areas of friction alongside actionable improvement ideas.
Compatibility & Formats
The template is fully compatible with PowerPoint and Google Slides, allowing smooth editing, brand customization, and collaboration across teams. All elements, colors, icons, and text fields can be tailored to fit your branding or customer-experience framework.
Login to download this file
What do you think of this template?
Category:
Business
Aspect Ratio: 16:9
Item ID: SPT0031
Color


