South Korea Regional Data Map Template for PowerPoint & Google Slides

Product Description
Description
This template is designed to present regional data and geographic insights for South Korea in a clear visual format. It is a fully editable presentation template, compatible with PowerPoint and Google Slides.
It helps users communicate location based information effectively.
The layout emphasizes clarity, accuracy, and professional data presentation.
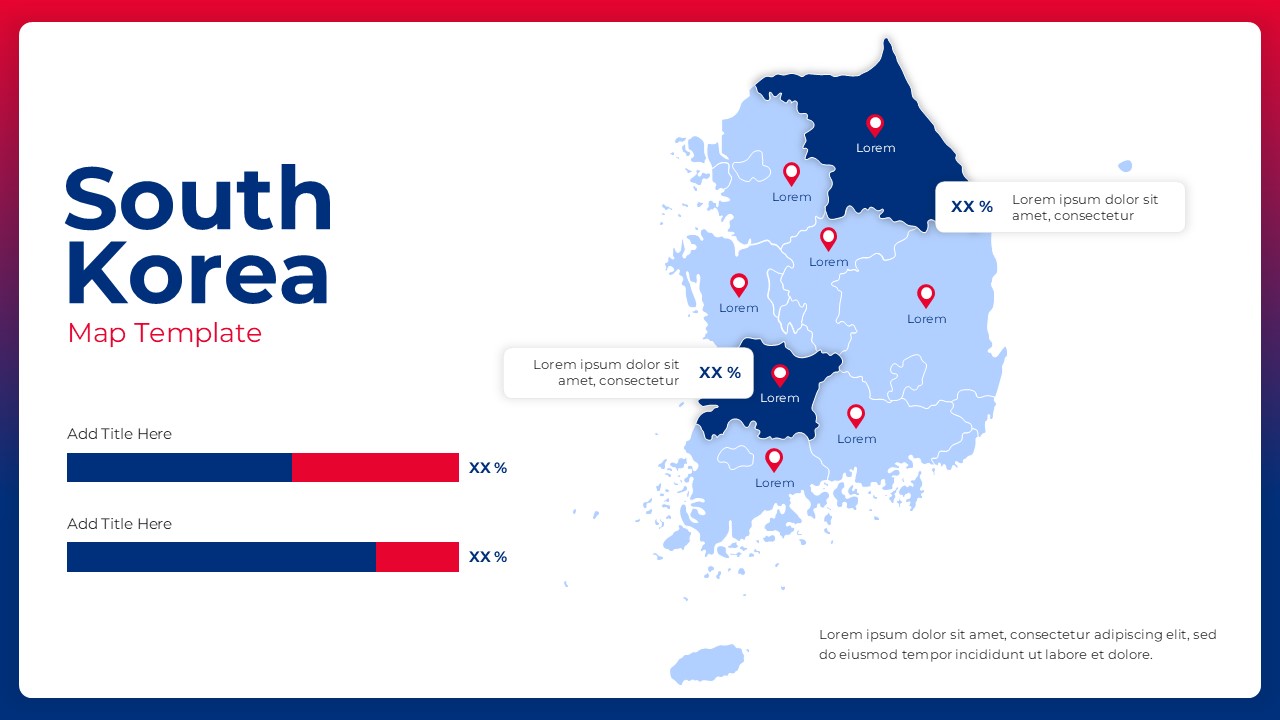
This template is ideal for showcasing regional performance, comparisons, or statistics across South Korea. With clearly defined provinces, markers, and percentage indicators, it allows audiences to quickly understand geographic trends. The clean and modern design makes it suitable for business, academic, and analytical presentations.
What’s Inside the Template
The template includes a detailed vector map of South Korea with distinct regional boundaries. Multiple location pins are placed across regions to highlight key cities or data points. On the side, horizontal progress style bars allow users to present comparative metrics such as growth, performance, or distribution percentages. Text placeholders are provided for titles, labels, and short descriptions, enabling structured storytelling alongside the map.
Key Features
- High quality vector map of South Korea with regional divisions
- Editable location markers for highlighting key areas
- Percentage and progress bars for data comparison
- Clean layout combining map visuals and data summaries
- Fully customizable colors, text, and regions
- Optimized for professional presentations
Ideal For
This template is ideal for business analysts, consultants, marketers, educators, and researchers working with geographic data. It works well for market analysis, regional performance reviews, sales territory planning, demographic studies, and country specific reports. Government and academic users can also apply it for informative or educational presentations.
Slide Highlights
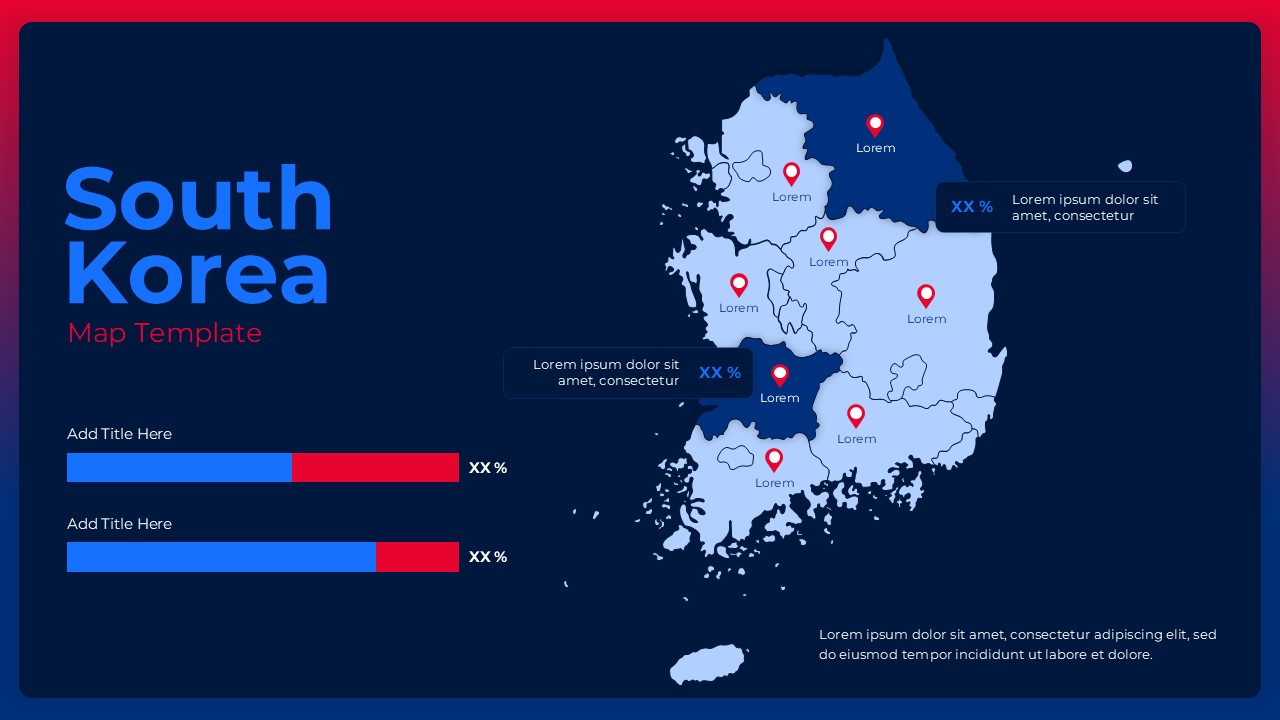
The slide highlights South Korea’s regions using layered color tones for easy differentiation. Location pins draw attention to important areas, while callout boxes allow specific data points to be explained clearly. The side bar indicators balance the layout by summarizing key metrics without overwhelming the map visualization.
Compatibility & Formats
The template is fully compatible with Microsoft PowerPoint and Google Slides. All elements are vector based and editable, ensuring smooth customization across platforms. It is optimized for widescreen formats and maintains visual clarity when presented or shared digitally.
Login to download this file
What do you think of this template?
Category:
Business
Aspect Ratio: 16:9
Item ID: SPT0273
Color


