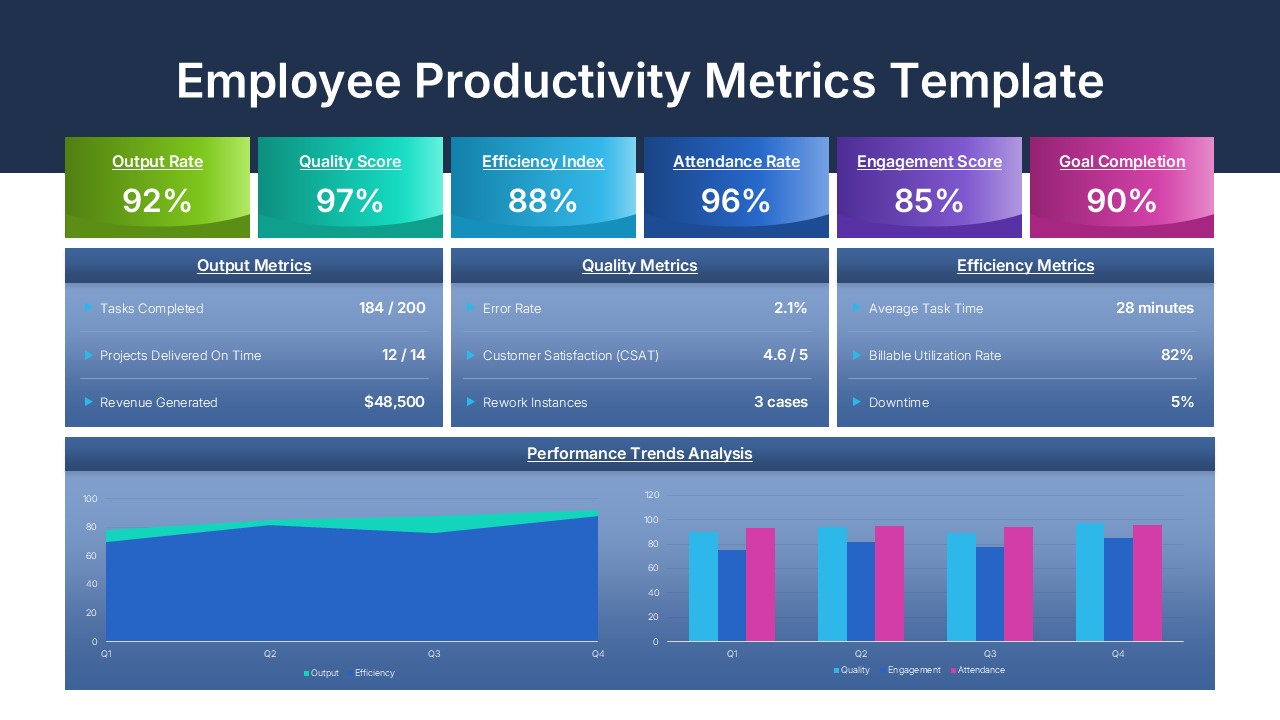
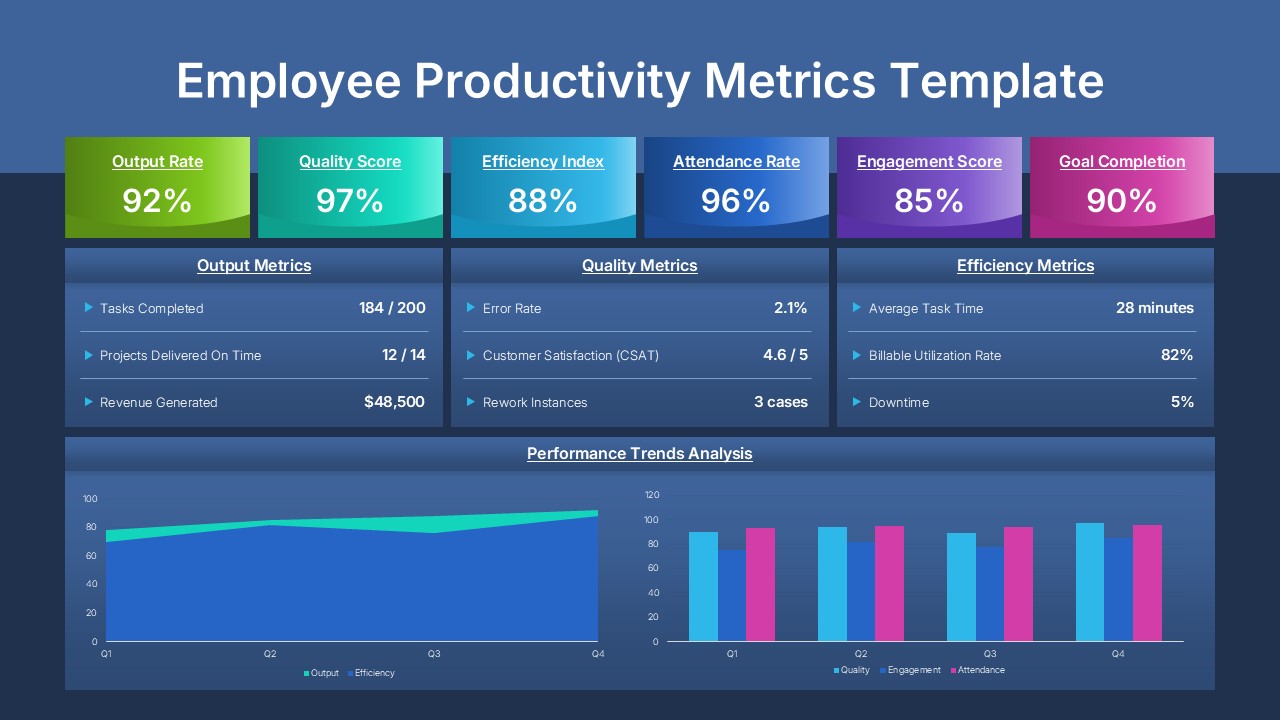
Employee Productivity Metrics Dashboard Template for PowerPoint & Google Slides
Product Description
Employee Productivity Metrics Report
This employee productivity metrics dashboard template provides a structured and visually engaging way to present performance data across output, quality, efficiency, attendance, engagement, and goal completion. It is a fully editable presentation template compatible with PowerPoint and Google Slides. Designed for clarity and professional reporting, the template helps teams and leaders communicate performance insights effectively. Its data driven layout is ideal for showcasing workforce productivity trends and actionable indicators.
The template allows presenters to consolidate KPIs into a unified view, offering an immediate understanding of strengths, gaps, and opportunities. With visually distinguished metric blocks and charts, it supports analytical discussions and performance review sessions.
What’s Inside the Employee Productivity Metrics Template
This dashboard style slide includes six highlighted KPI panels that present summary scores for output rate, quality score, efficiency index, attendance rate, engagement score, and goal completion. Underneath, the template organizes supporting metrics into three sections labeled Output Metrics, Quality Metrics, and Efficiency Metrics. Each section provides space to display specific data points such as tasks completed, revenue generated, error rate, customer satisfaction, billable utilization, and downtime.
The lower portion of the slide features two performance trend visualizations. The first is a line and area chart illustrating quarterly changes in output and efficiency. The second is a grouped bar chart comparing quality, engagement, and attendance across four quarters.
Key Features of Employee Productivity Metrics Template
- Fully customizable KPI blocks, charts, text, and colors
- Professional dashboard layout for fast data interpretation
- Dedicated sections for output, quality, and efficiency metrics
- Line, area, and bar charts for trend presentation
- PowerPoint and Google Slides compatibility
- High resolution design suitable for reports and presentations
Ideal For
This template is ideal for HR teams, department managers, operations leaders, and analysts who need to track and present employee productivity results. It is well suited for performance review meetings, quarterly business reviews, workforce optimization discussions, and ongoing monitoring of team output and effectiveness.
Slide Highlights
The template’s top row of colored KPI blocks draws immediate attention to headline performance indicators. Below, a clean grid layout organizes supporting metrics for quick comparison. The dual chart section offers a clear view of performance movement over time, enabling presenters to explain patterns, trends, and insights. The use of gradient panels and high contrast typography enhances readability across the entire dashboard.
Compatibility & Formats
This template works seamlessly with both PowerPoint and Google Slides. All shapes, icons, charts, and text fields are fully editable, allowing users to adjust colors, data values, fonts, and layout elements to match organizational branding and reporting needs.
Login to download this file
What do you think of this template?


