Energy Pyramid PowerPoint & Google Slides Template


Product Description
Teaching or presenting ecological concepts becomes a lot clearer when you have a visual that does the explaining for you. This energy pyramid template is built for science educators, students, and environmental researchers who need a ready-to-use slide that shows energy flow across trophic levels without having to build one from scratch. It works in both Microsoft PowerPoint and Google Slides, so editing and sharing it with your class or team takes no extra effort.
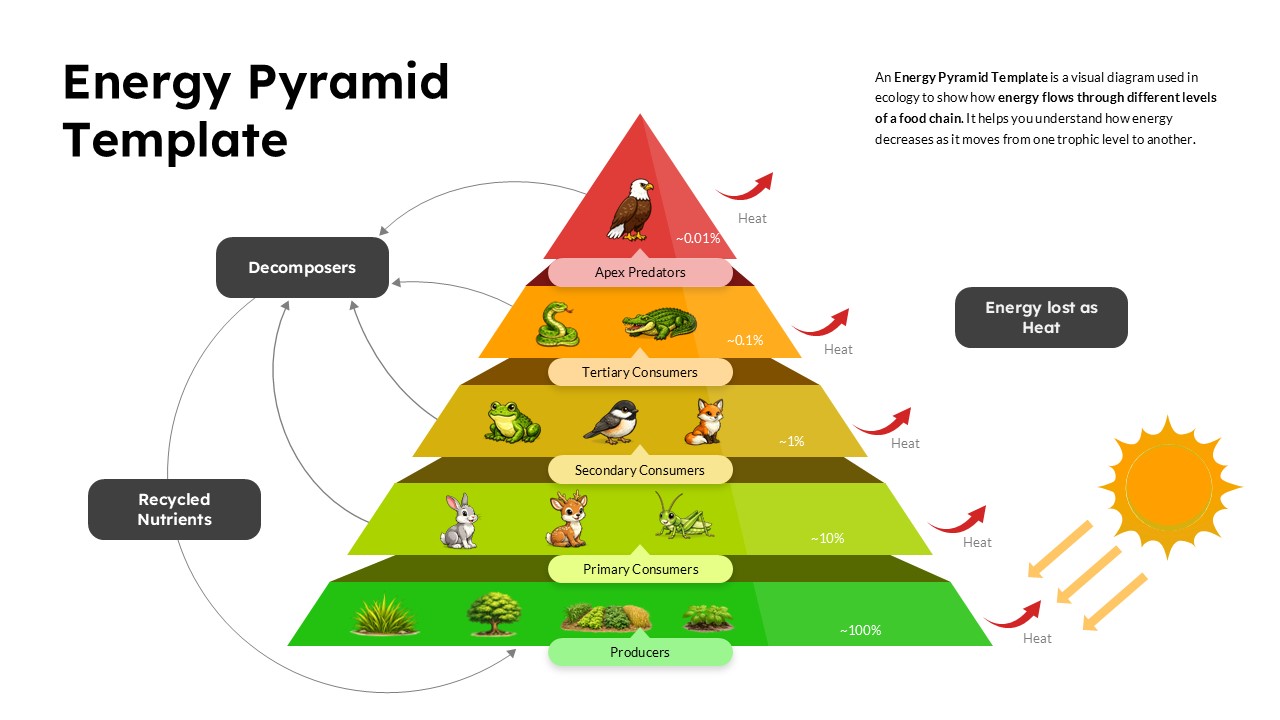
The slide uses a classic pyramid diagram divided into horizontal tiers, each representing a level in the food chain or energy transfer hierarchy. From producers at the base to top-level consumers at the peak, every tier is clearly labeled and color-coded so your audience can read the information at a glance. The design is clean and well-spaced, giving you enough room to add your own labels, percentages, or descriptions to each level. A light version of this ecological pyramid template is also included in the download, which works nicely for printed worksheets or classroom handouts.
How This Trophic Level Diagram Helps Your Presentation
A pyramid chart like this one takes a concept that can be hard to explain in words and turns it into something anyone can understand in seconds. Whether you are covering energy flow in ecosystems, food web structures, or biomass distribution across levels, this template gives your content a visual anchor that keeps your audience engaged. It is a practical tool for high school biology lessons, college-level ecology courses, and environmental science presentations alike.
What Comes With This Template
- A multi-tier energy pyramid diagram with editable labels for each trophic level
- Color-coded sections that clearly separate each stage of the energy flow
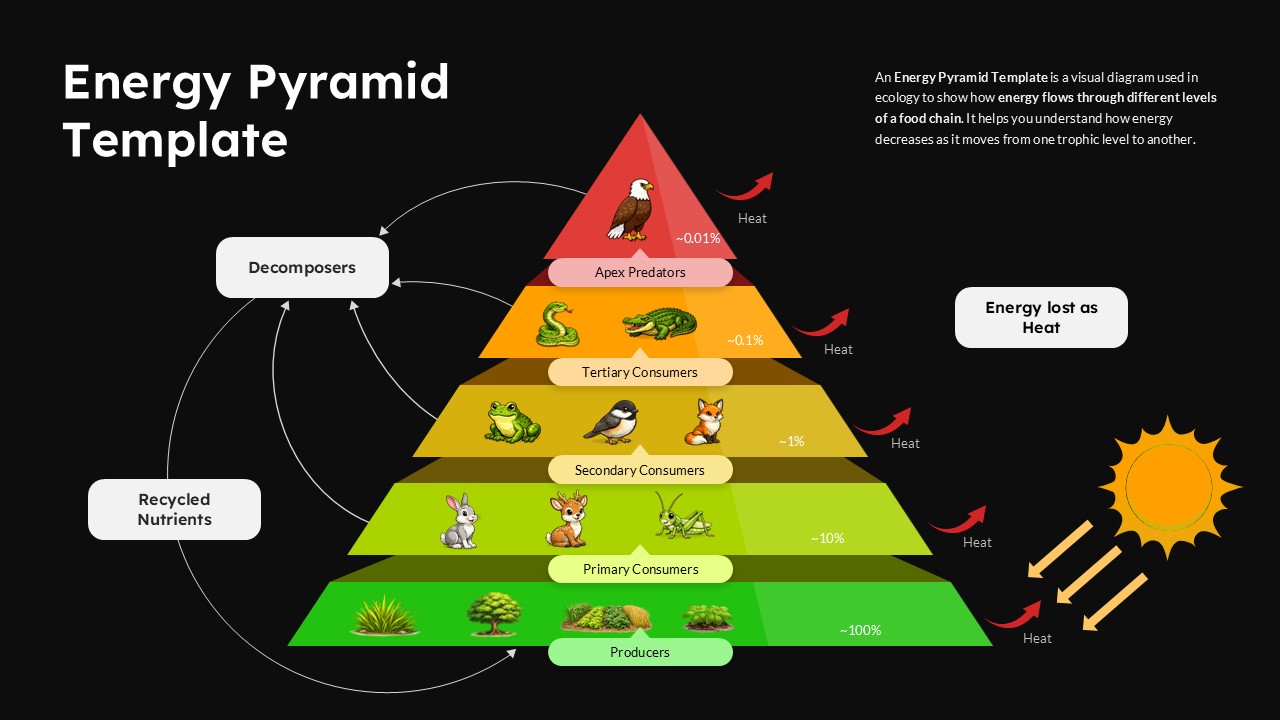
- Light and dark slide variations included in one download
- Fully editable text, colors, and layout in both PowerPoint and Google Slides
- A clean science-friendly design suitable for academic and professional presentations
There is no need to draw a pyramid diagram by hand or spend time aligning shapes on a blank slide. This food chain pyramid template gives you a finished, presentation-ready layout that looks consistent and professional from the moment you open it.
Download this energy pyramid template today and make your next science or ecology presentation easier to follow and more visually engaging.
Frequently Asked Questions
Can I modify the energy percentages and trophic level labels in this template?
Yes, all text elements including energy percentages, trophic level names, and descriptive labels are fully editable. You can customize the content to match specific ecosystems or adjust the percentages based on your research data or curriculum requirements.
Does this template work for both terrestrial and aquatic ecosystem presentations?
Absolutely! The template's generic design with customizable icons and text makes it suitable for any ecosystem type. You can easily replace the animal and plant graphics to represent marine life, forest species, grassland organisms, or any specific habitat you're studying.
Are there different color schemes available besides the gradient shown?
The template includes both light and dark background variants, and since all elements are fully editable, you can modify the color scheme to match your presentation needs or institutional branding while maintaining the scientific accuracy of the trophic level visualization.
Login to download this file
What do you think of this template?
Category:
Diagrams
Aspect Ratio: 16:9
Item ID: SPT0684
Color


