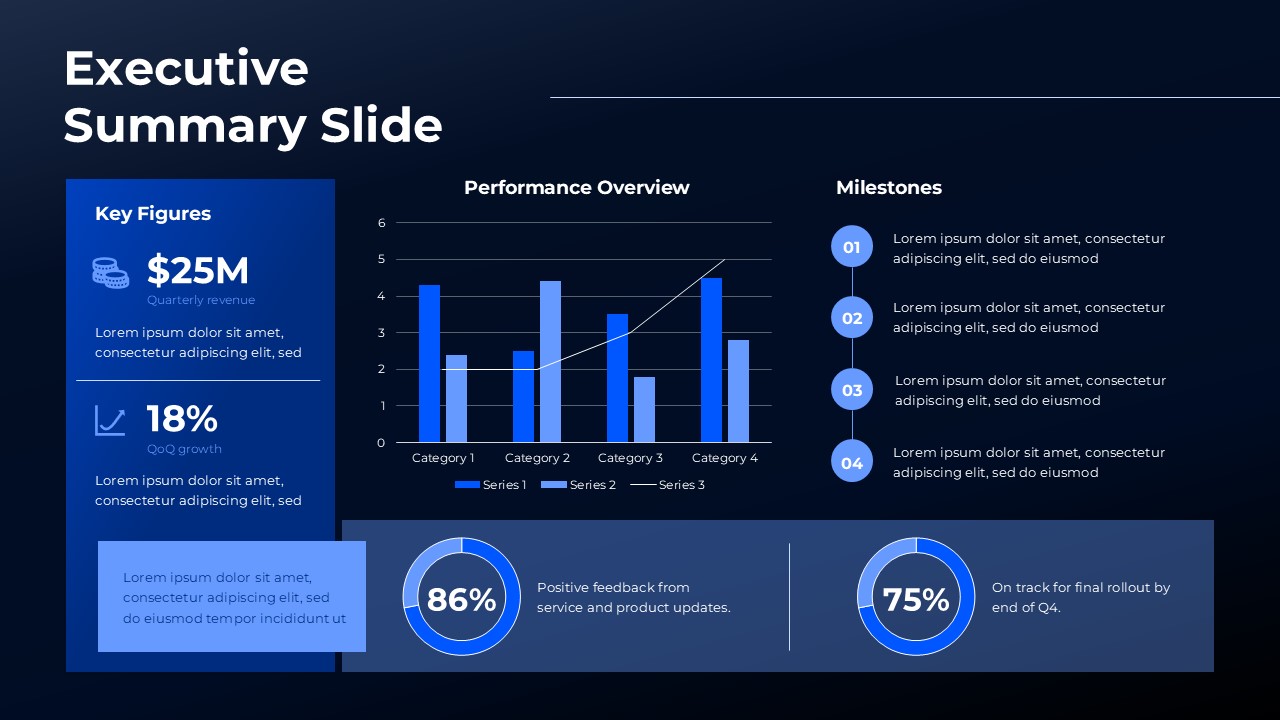
Executive Summary Slide Template Dark

This template is part of a deck featuring multiple slides. To check out all slides.
See All
Product Description
Description
This Executive Summary Slide template provides a clear, visually structured overview of business performance, making it ideal for leadership updates, quarterly reviews, and stakeholder reporting. Designed with a modern blue-toned layout, the slide highlights essential business metrics, performance trends, and milestone tracking in a single, executive-friendly snapshot. Its refined aesthetic ensures that complex data becomes easy to understand, enabling faster, data-driven decision-making.
What’s Inside the Template
The layout is divided into three well-organized sections. On the left, a “Key Figures” panel summarizes headline metrics such as revenue, growth percentages, and supporting contextual descriptions. The central area features a multi-series bar and line chart visualizing performance across multiple categories, helping presenters compare trends at a glance. On the right, a vertical milestones section outlines four sequential achievement points, perfect for tracking project progress or operational updates.
Along the bottom, two donut-style KPI graphics emphasize key performance indicators—such as feedback scores or rollout completion rates—offering a concise view of results that matter most.
Key Features
- Clean, executive-ready layout ideal for reporting and reviews
- Multi-series bar and line chart for comparative performance analysis
- KPI donut charts for quick visualization of core metrics
- Milestone tracker supporting chronological or process-based storytelling
- Balanced white space and visual hierarchy for high readability
- Fully editable colors, charts, and text fields
Ideal For
This template is well-suited for business leaders, analysts, consultants, and project managers who need to communicate metrics clearly. It works especially well for quarterly business reviews, investor updates, project briefings, and internal strategic presentations.
Slide Highlights
- Key Figures Panel: A bold, left-aligned metrics block emphasizing revenue, growth, and essential commentary.
- Performance Overview Chart: Combined bar and line chart visualizes multi-series data for deeper insight.
- Milestone Timeline: Four circular markers connected vertically, ideal for progress or roadmap updates.
- KPI Donut Charts: Engaging visual indicators showing progress percentages and performance ratings.
Compatibility & Formats
Compatible with Microsoft PowerPoint and Google Slides, the template is fully editable, allowing users to adapt colors, charts, icons, and text to match any brand or reporting format.
Login to download this file
What do you think of this template?