Fault Tree Analysis PowerPoint & Google Slides Template

Product Description
Fault Tree Analysis Template
This fault tree analysis template is built to help teams visually map out system failures, causal pathways, and root cause relationships within a structured diagram. As a fully editable presentation template, it works in both PowerPoint and Google Slides, offering complete flexibility to adjust shapes, connectors, colors, and labels. Its primary purpose is to support risk assessments, problem solving reviews, and technical evaluations by breaking down complex failure scenarios into clear logical branches. The diagram enhances communication during engineering discussions, quality analysis sessions, and system design reviews, ensuring alignment with analysis workflows across industries.
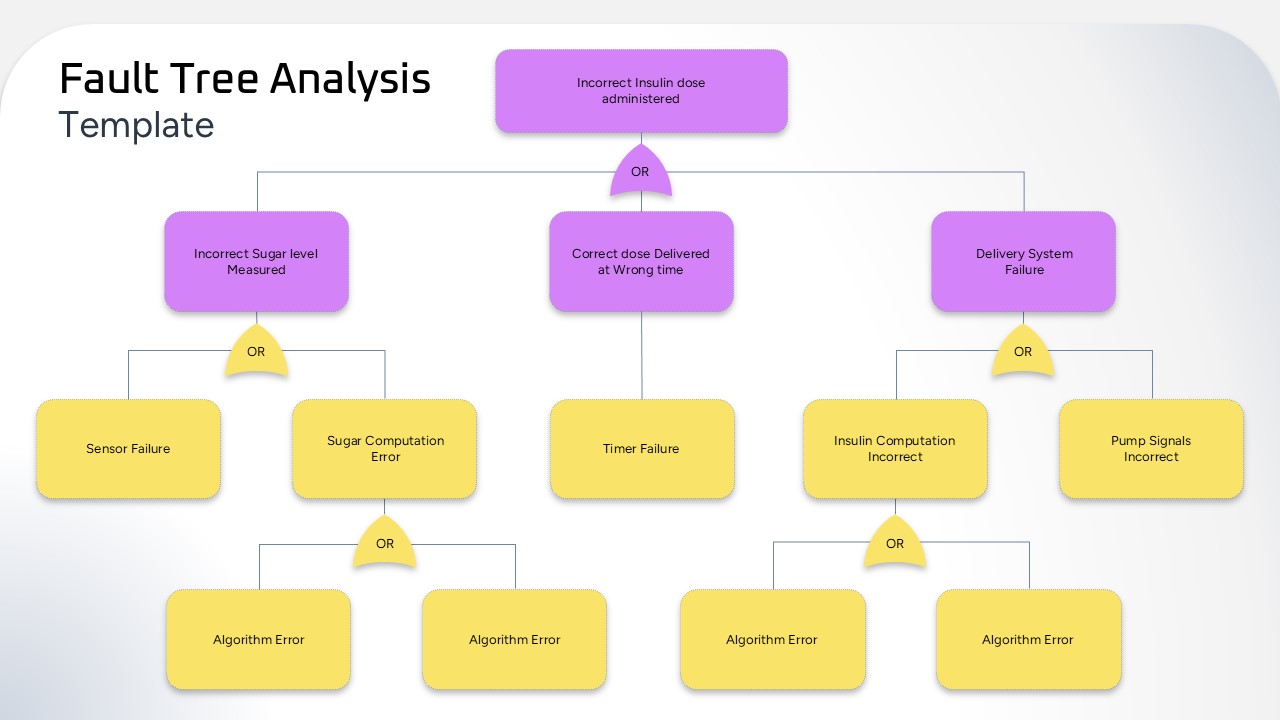
The template begins with a top level failure event and branches downward through logic gates, allowing presenters to explain dependencies and contributing factors in a logical, easy to follow manner. This structure helps teams identify vulnerabilities and prioritize corrective actions with clarity.
What’s Inside the Fault Tree Analysis Template
The slide features a hierarchical tree diagram starting with a primary failure node, followed by layered child nodes representing contributing issues such as measurement errors, timing faults, and delivery system failures. Logical OR gates visually connect causal factors, supporting a systematic breakdown of events. Color coding distinguishes major categories from detailed underlying causes, and soft rounded rectangles improve readability. At the bottom layer, algorithm related errors demonstrate deeper root causes often identified during technical evaluations.
Key Features of Fault Tree Analysis Template
- Structured fault tree layout for root cause decomposition
- Clear logic gate indicators to distinguish causal relationships
- Editable nodes, connectors, and color schemes
- Visual hierarchy that supports engineering level communication
- Suitable for technical reviews, risk assessments, and quality audits
Ideal For
This template is ideal for engineers, quality assurance professionals, risk analysts, system designers, and operations teams conducting failure investigations or preventive analysis. It also supports cross functional discussions where technical clarity is required to understand interdependent faults.
Slide Highlights
The diagram’s tiered layout ensures a coherent flow from top level failure to specific contributing factors. Distinctive colors separate major error types, improving visual segmentation and comprehension. Balanced spacing prevents clutter, while the inclusion of logic gates strengthens analytical precision, making the slide highly effective for presenting structured insights aligned with root cause evaluation frameworks.
Compatibility & Formats
Fully compatible with PowerPoint and Google Slides, this template allows easy editing of flow elements and text. Teams can customize the diagram quickly to fit various failure scenarios while maintaining professional design consistency.
Login to download this file
What do you think of this template?
Category:
Risk Management
Aspect Ratio: 16:9
Item ID: SPT0530
Color
Related Templates
-
-
-
-
Free KPI Tree Strategy Hierarchy Template for PowerPoint & Google Slides
Business Strategy
-
-
-
-
-
-
Risk Management Process Diagram for PowerPoint & Google Slides
Risk Management
-
-


