Japan Map Infographic Template for PowerPoint & Google Slides

Product Description
Description
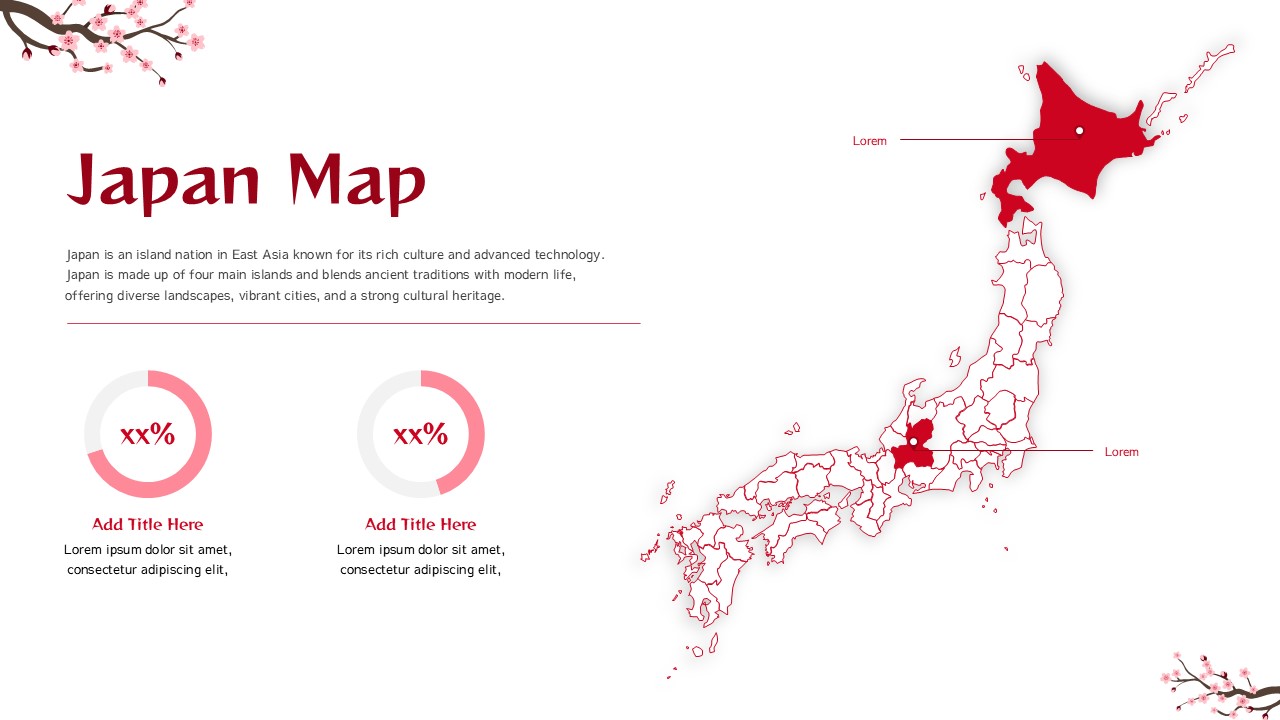
This Japan map infographic is designed to visually present geographic data, regional insights, and location based information in a clear and professional format. It is a fully editable presentation template, compatible with PowerPoint and Google Slides, making it suitable for business, education, and research use cases. The layout combines a detailed country map with supporting data visuals to enhance storytelling.
This template helps transform location specific information into an engaging and easy to understand visual presentation.
What’s Inside the Template
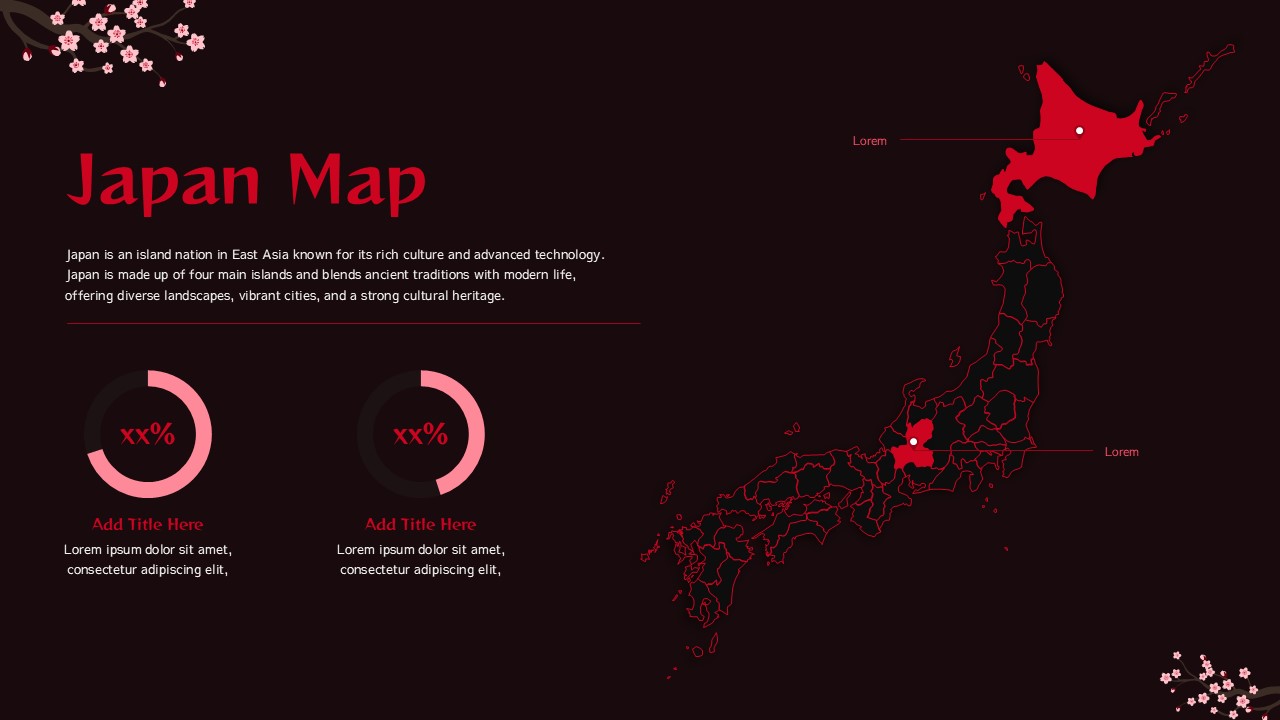
The template features a clean outline map of Japan with prefecture level boundaries clearly displayed. Highlighted regions allow users to draw attention to specific areas, supported by callout labels for annotations or descriptions. The slide also includes circular percentage charts that can be used to showcase statistics, comparisons, or key metrics related to regions, demographics, or performance indicators. Decorative elements inspired by Japanese aesthetics add visual character while keeping the design professional and presentation ready. All components are fully editable, including map colors, labels, charts, and text.
Key Features
- Editable Japan map with prefecture level detail
- Highlighted regions with callout labels for annotations
- Integrated circular charts for key statistics
- Clean infographic layout with cultural design accents
- Fully customizable colors, text, and data visuals
Ideal For
This template is ideal for business presentations, market analysis, and regional reports focused on Japan. It works well for educators, consultants, researchers, and marketing teams presenting geographic insights, expansion plans, demographic data, or regional performance. Travel, cultural, and academic presentations can also benefit from its clear and visually appealing structure.
Slide Highlights
The slide highlights a large, detailed map of Japan balanced with supporting data visuals on the left side. Strategic use of color helps emphasize selected regions without overwhelming the design. The combination of geographic and numeric elements allows presenters to communicate both location context and quantitative insights on a single slide.
Compatibility & Formats
This template is fully compatible with Microsoft PowerPoint and Google Slides. All elements are editable without additional fonts or plugins, ensuring smooth customization and easy collaboration across platforms.
Login to download this file
What do you think of this template?
Category:
Business
Aspect Ratio: 16:9
Item ID: SPT0267
Color
Related Templates
-
-
-
-
-
-
-
Editable Germany Map for PowerPoint & Google Slides
Infographics
-
-
-
-
-


