KPI Dashboard & Performance Tracking Template for PowerPoint & Google Slides


Product Description
Description
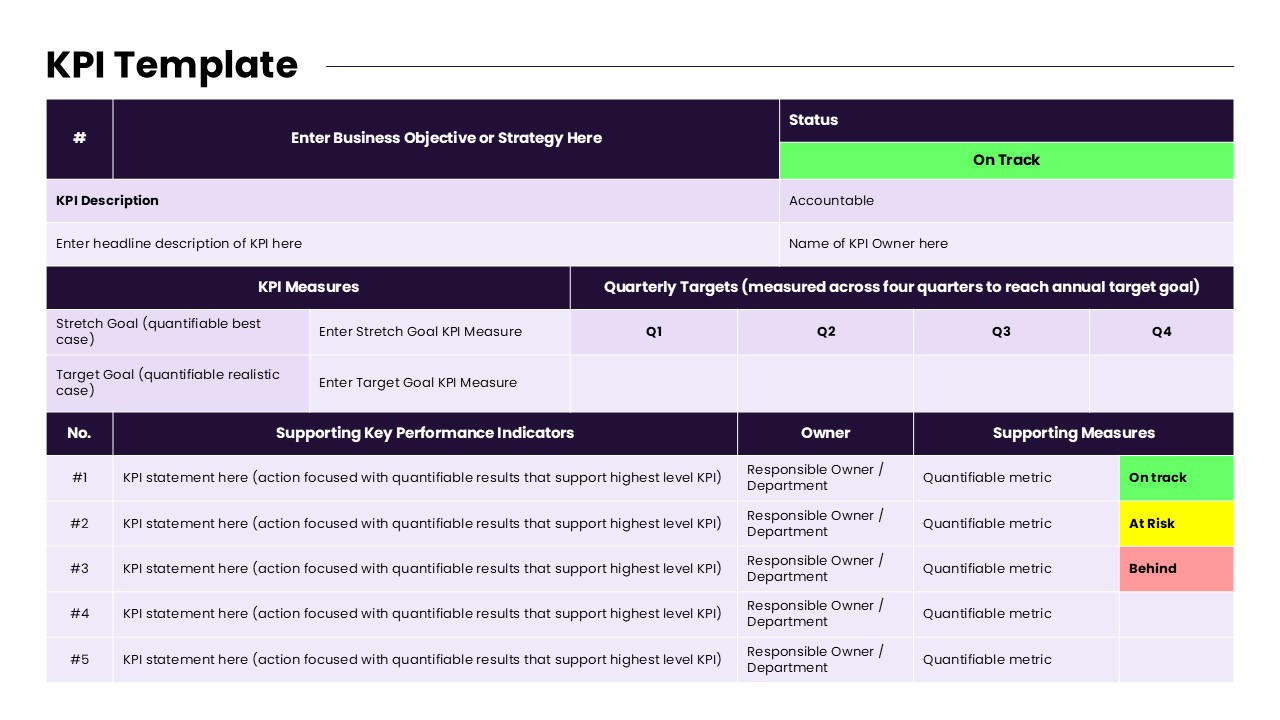
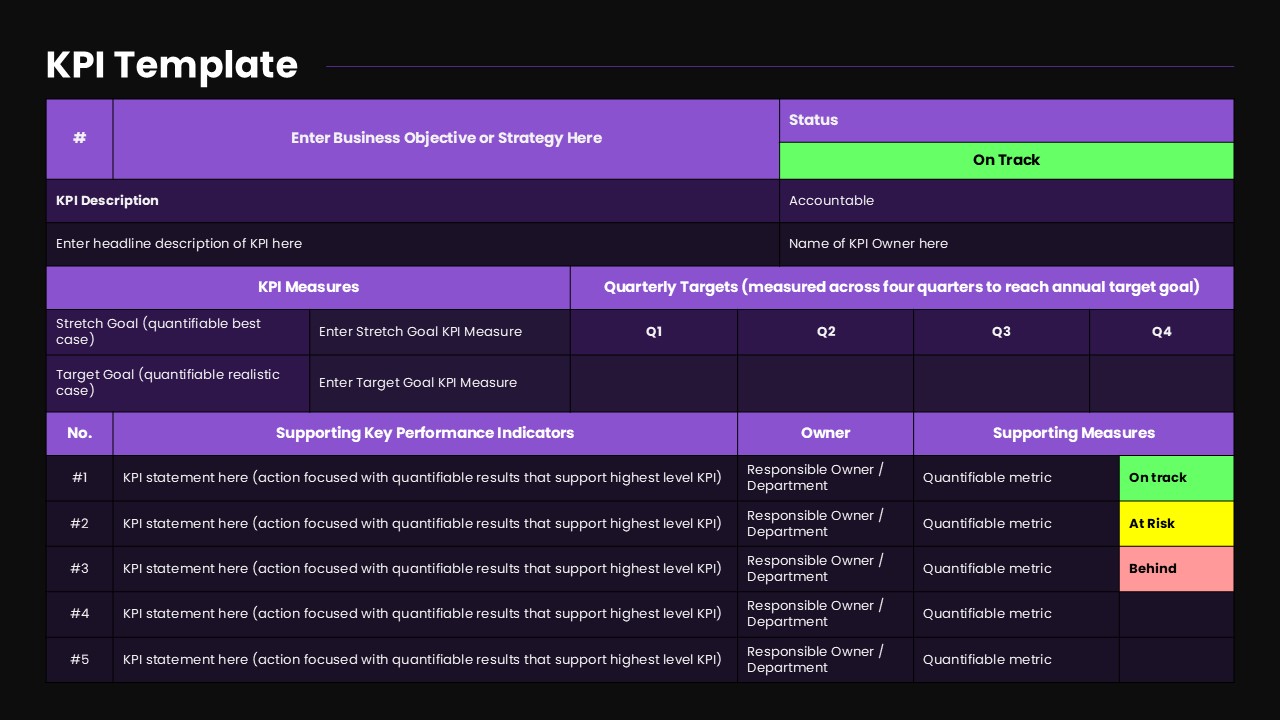
This KPI Dashboard & Performance Tracking template provides a structured and visually intuitive system for outlining business objectives, defining measurable outcomes, and monitoring progress across multiple quarters. Designed for teams seeking clarity and accountability, it supports both strategic planning and operational reporting. The layout uses clean table structures, color-coded status indicators, and clearly separated KPI tiers to help users communicate performance expectations with confidence and precision. It is suitable for presentations that require transparency in performance monitoring, whether used in leadership meetings, departmental reviews, or project updates.
What’s Inside the Template
The template includes a comprehensive KPI framework beginning with an area to define the core business objective or strategy. Users can add a headline description, outline accountability roles, and identify the primary KPI owner. A detailed KPI Measures section enables teams to capture both stretch goals and realistic target goals. Additionally, quarterly columns allow for measurable tracking throughout Q1 to Q4. The lower portion presents a structured list of supporting KPIs, each with fields for statements, responsible owners, and quantifiable metrics. Status labels—such as “On Track,” “At Risk,” and “Behind”—make it easy to communicate current performance at a glance.
Key Features
- Clear hierarchy for defining objectives, main KPIs, and supporting indicators
- Quarterly tracking grid aligned with annual targets
- Color-coded performance statuses for immediate visual clarity
- Defined ownership fields to reinforce accountability
- Flexible layout suitable for cross-functional or departmental reporting
- Intuitive table format that maintains clarity even with multiple KPIs
Ideal For
This template is ideal for business leaders, HR teams, project managers, analysts, and department heads who regularly monitor performance metrics. It supports quarterly business reviews, strategic execution updates, annual planning cycles, and performance management discussions. Organizations aiming to standardize KPI reporting across teams will benefit from its consistent structure.
Slide Highlights
- A bold header section to clearly present strategic objectives
- Dedicated KPI description and ownership fields for improved context
- Stretch vs. target goal comparison for realistic expectation-setting
- Quarterly targets displayed in a simplified four-column format
- Status indicators using distinct color signals to improve decision-making
- A structured list of supporting KPIs for deeper metric visibility
Compatibility & Formats
This template is fully compatible with both PowerPoint and Google Slides. All elements are editable, allowing users to adjust tables, colors, text fields, and indicators to match their organizational standards or reporting frameworks.
Login to download this file
What do you think of this template?
Category:
Business
Aspect Ratio: 16:9
Item ID: SPT0081
Color


