Professional Line Chart Template for PowerPoint & Google Slides

Product Description
Overview
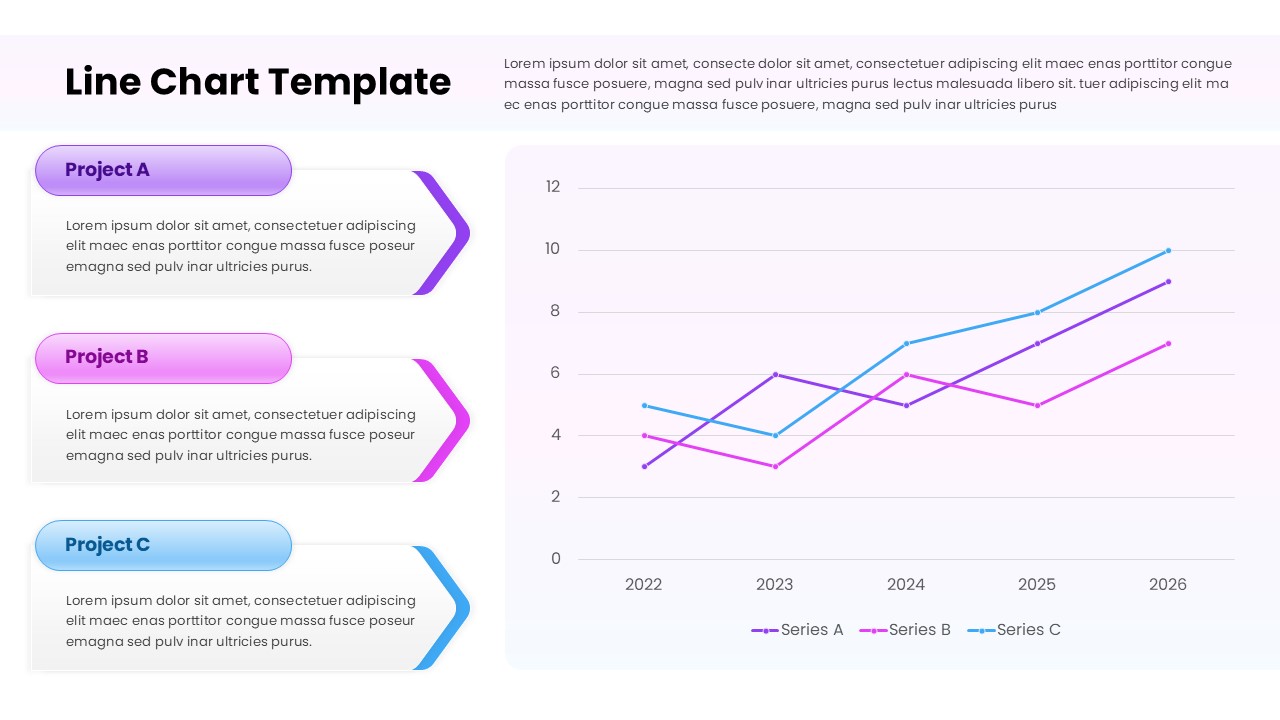
This line chart presentation template is designed to visualize data trends over time with clarity and visual balance. It is a fully editable presentation template, compatible with PowerPoint and Google Slides, built for clear comparison of multiple data series. The layout supports year over year performance tracking, project progress analysis, and analytical storytelling. The design focuses on readability, structured labeling, and professional color usage for business reporting.
What’s Inside the Template
The template includes a structured slide layout combining descriptive text blocks with a multi series line chart. On the left side, dedicated content sections allow users to explain different projects or categories with short descriptions. On the right side, a large line graph displays data points across multiple time periods, making trends easy to interpret. The slide is designed to accommodate three data series with clear legends and axis labeling. All elements including text, chart values, colors, and labels are fully editable, allowing users to adapt the slide for various analytical contexts.
Key Features
- Fully editable line chart with multiple data series
- Clean layout optimized for data driven presentations
- Customizable colors, labels, and legends
- Balanced text and chart composition for clarity
- Suitable for reports, dashboards, and strategy reviews
Ideal For
This template is ideal for business professionals, analysts, consultants, and project managers who need to present performance trends or comparisons over time. It works well for sales reports, financial tracking, KPI reviews, marketing analytics, and operational performance updates. Educators and students can also use it for data analysis presentations and academic reporting.
Slide Highlights
The slide highlights include a large, easy to read line chart covering multiple years, paired with structured project description sections. The visual hierarchy ensures that key data trends remain the focal point while supporting context is clearly communicated. Smooth color transitions and spacing help maintain a professional and modern appearance suitable for executive level presentations.
Compatibility & Formats
This presentation template is fully compatible with PowerPoint and Google Slides. It supports easy editing across platforms without design or formatting issues. Users can update charts, text, and colors directly within their preferred presentation software.
Login to download this file
What do you think of this template?
Category:
Business Reports
Aspect Ratio: 16:9
Item ID: SPT0194
Color


