Optimal Capital Structure PowerPoint & Google Slides Template
Product Description
Capital Structure Optimization Presentation Template
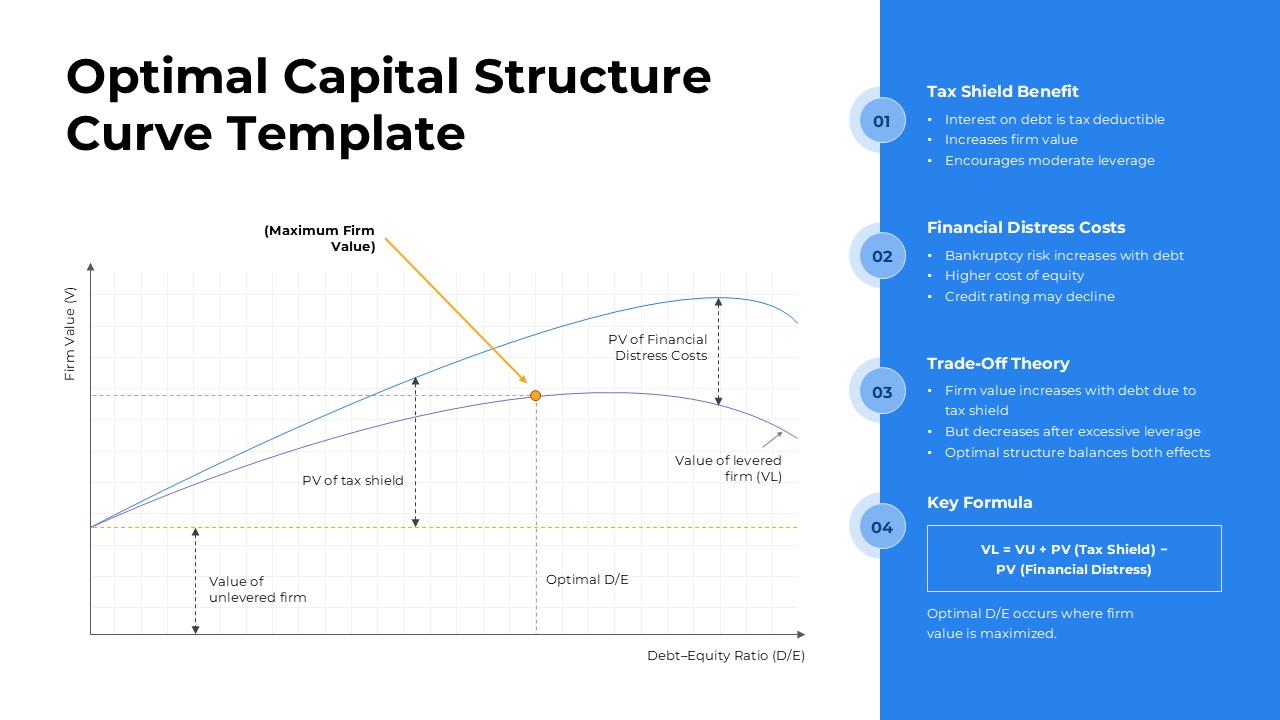
This comprehensive optimal capital structure template delivers a clear visual representation of the trade-off theory of capital structure, featuring professional charts that illustrate the relationship between firm value and debt-equity ratios. The template is completely editable in both Microsoft PowerPoint and Google Slides, allowing you to customize every element to match your specific presentation needs. Perfect for explaining complex financial concepts, this template transforms theoretical frameworks into engaging visual presentations that help audiences understand the balance between tax benefits and financial distress costs in capital structure decisions.
The template features a sophisticated two-column layout with a prominent curved chart displaying the optimal capital structure relationship on the left side, complemented by a structured information panel in professional blue tones on the right. Orange highlighting strategically marks key points like the maximum firm value marker, while clean typography ensures excellent readability across both light and dark theme variations. The visual design maintains academic professionalism while remaining accessible and engaging for diverse audiences.
What’s Inside Our Optimal Capital Structure Template
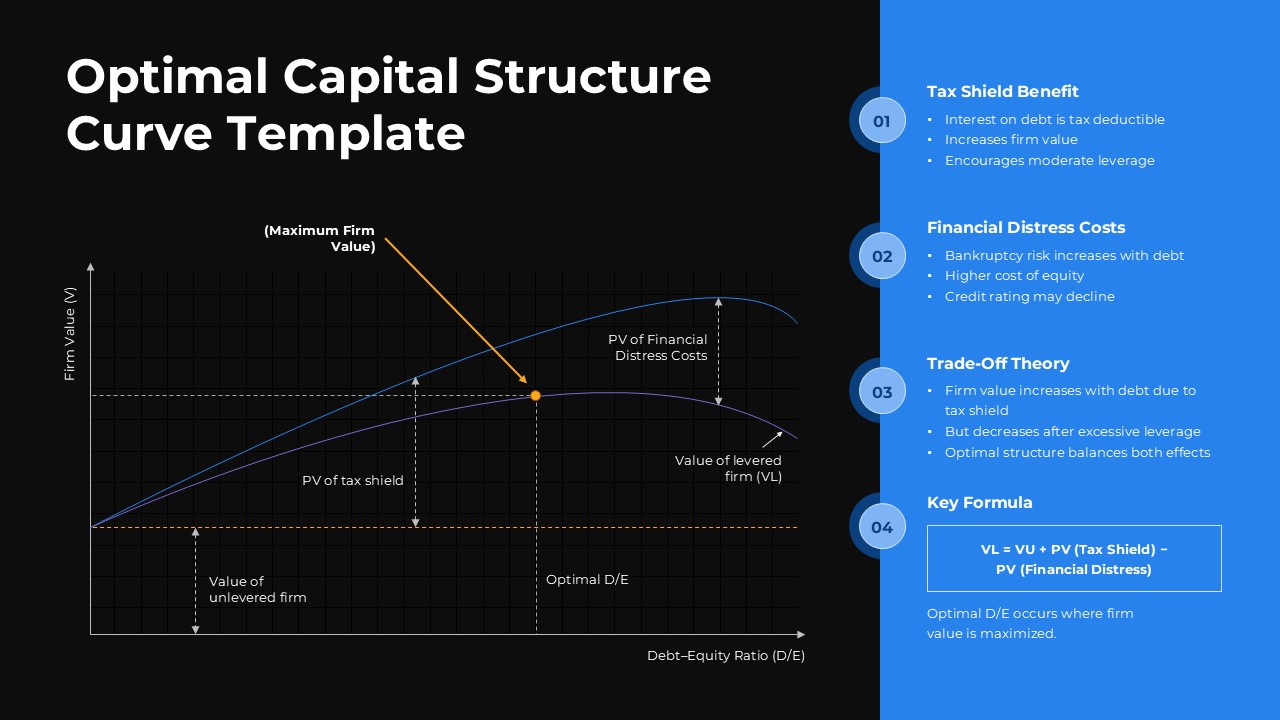
This template includes two expertly designed slides featuring identical content in both light and dark theme options. Each slide contains a detailed curved graph showing firm value versus debt-equity ratios, with clearly labeled components including present value of tax shields, financial distress costs, and the value of levered firms. The right panel organizes information into four numbered sections covering tax shield benefits, financial distress costs, trade-off theory explanation, and the key valuation formula. The design incorporates professional blue accent colors with strategic orange highlighting for emphasis.
Key Features of This Optimal Capital Structure Template
- Two professionally designed slides with light and dark theme options
- Detailed optimal capital structure curve with labeled components
- Four-section information breakdown covering key theoretical concepts
- Clear mathematical formula presentation for firm valuation
- Professional color scheme with blue accents and orange highlights
- Fully editable charts, text, and visual elements
- 16:9 aspect ratio optimized for modern presentation displays
- Academic-grade design suitable for professional and educational settings
Ideal For
This template is perfect for finance professors, MBA instructors, corporate trainers, and financial consultants who need to explain capital structure concepts effectively. It serves educational presentation slides in academic settings while also supporting investment bankers, CFOs, and financial analysts presenting to executive teams or board members. The template is particularly valuable for CFA exam preparation courses, corporate finance workshops, and strategic planning sessions where understanding optimal leverage decisions is crucial for business success.
Compatibility & Formats
Designed for seamless compatibility with both Microsoft PowerPoint and Google Slides, this template ensures all elements remain fully editable and professionally formatted. Every component, from chart visualizations to text elements, can be customized to match your brand colors, fonts, and specific presentation requirements while maintaining the template’s professional appearance and educational effectiveness.
Frequently Asked Questions
Can I modify the optimal capital structure curve and data points in this template?
Yes, absolutely! All chart elements including the curve, data points, labels, and axis values are fully editable in both PowerPoint and Google Slides. You can adjust the curve shape, modify labels, change colors, and customize the chart to reflect specific company data or theoretical scenarios for your presentation needs.
Does this template include explanations of the financial formulas shown?
The template includes the key valuation formula (VL = VU + PV(Tax Shield) - PV(Financial Distress)) and four detailed sections explaining tax shield benefits, financial distress costs, trade-off theory, and practical applications. All text is editable, allowing you to expand explanations or add additional formulas as needed for your audience.
Is this template suitable for both academic and corporate presentations?
Yes, this template is designed with professional academic standards while remaining suitable for corporate environments. The clean, professional design works well for MBA courses, finance training programs, board presentations, and strategic planning meetings. Both light and dark theme options ensure versatility across different presentation settings and audience preferences.
Login to download this file
What do you think of this template?
Category:
Finance
Aspect Ratio: 16:9
Item ID: SPT0625
Color
Related Templates
-
-
-
-
-
-
Pareto 80/20 Rule Chart PowerPoint & Google Slides Template
Charts & Graphs
-
-
Dupont Bradley Curve PowerPoint & Google Slides Template
Business Strategy
-
Blue Ocean Strategy Canvas Infographic for PowerPoint & Google Slides
Business Strategy
-
-
-


