PhD Timeline Gantt Chart Planning Template for PowerPoint & Google Slides
Product Description
Phd Timeline Gantt Chart
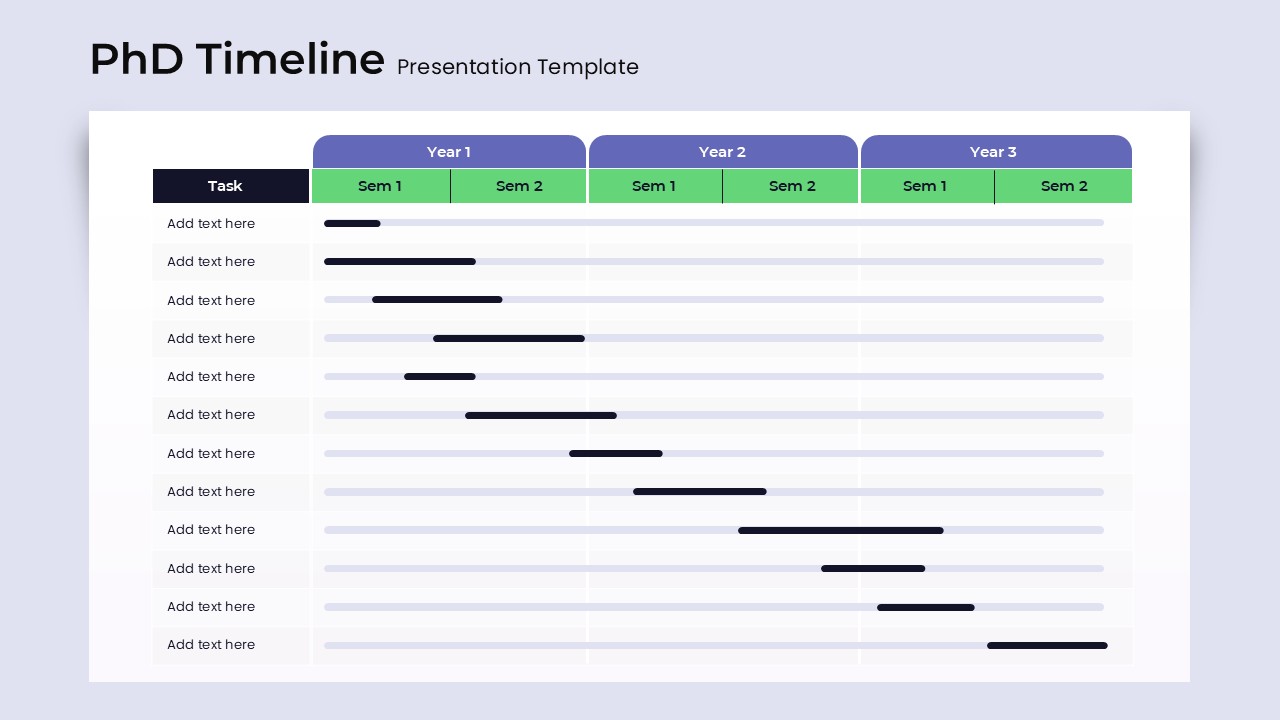
This PhD timeline presentation template is designed to help students and academic supervisors plan and visualize multi year research milestones with clarity. The product is a fully editable presentation template, compatible with PowerPoint and Google Slides. It provides a structured view of tasks across semesters, allowing users to outline coursework, research phases, fieldwork, writing periods, and deadlines in a clear chronological format. The design supports both high level planning and detailed academic scheduling, making it suitable for proposal defenses, committee presentations, and project tracking. Every element can be customized, making it easy to adapt the timeline to any doctoral program, institution, or study discipline.
What’s Inside the Phd Timeline Template
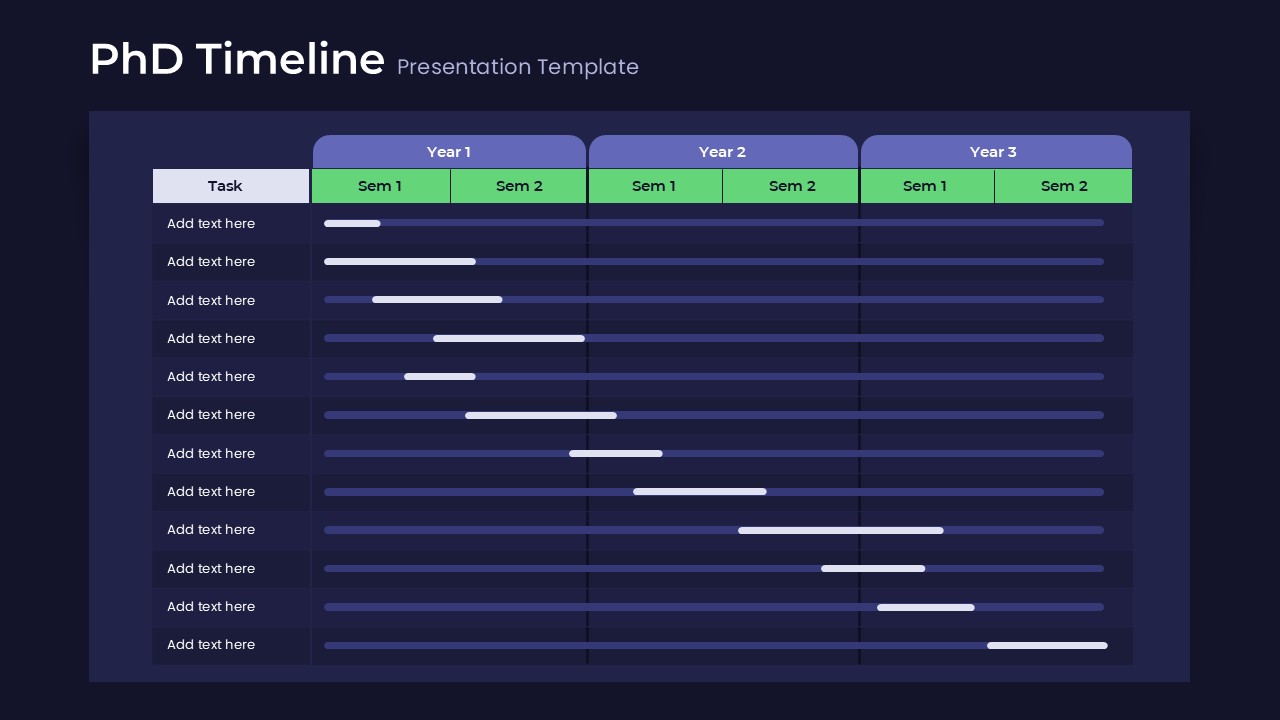
The template features a three year horizontal layout divided into two semesters per year. Each semester is color coded and clearly labeled to help the audience understand the academic structure at a glance. The left column lists task items, while the main grid displays timeline bars that stretch across months or semesters. These editable bars allow users to represent the duration of key activities such as literature review, data collection, analysis, teaching duties, or dissertation writing. The layout balances readability with flexibility so that it can support both detailed and simplified PhD schedules.
Key Features of Phd Timeline Template
• Fully editable Gantt style timeline bars
• Clearly segmented academic years and semesters
• Customizable task labels and duration indicators
• Professional layout suitable for academic and research presentations
• Compatible with PowerPoint and Google Slides
• Clean design optimized for long term planning
Ideal For
PhD candidates, supervisors, researchers, and academic departments who need to communicate research timelines or degree progress will benefit from this template. It is effective for proposal presentations, annual reviews, academic planning workshops, or any setting where long term study plans must be visually outlined.
Slide Highlights
The slide showcases a multi year visual timeline that resembles a refined Gantt chart. Soft color blocks and clear lines guide the eye through tasks and semesters, while the bold task column ensures the structure remains organized. The clean grid system reinforces clarity, making complex research plans manageable and easy for committees or audiences to assess.
Compatibility & Formats
This template is fully compatible with PowerPoint and Google Slides. All colors, task fields, and timeline bars can be edited to match institutional guidelines or personal preferences. Users can duplicate rows, adjust durations, and modify headings effortlessly.
Login to download this file
What do you think of this template?
Category:
Project Status
Aspect Ratio: 16:9
Item ID: SPT0464
Color
Related Templates
-
Modern Gantt Chart Project Timeline Template for PowerPoint & Google Slides
Project Management
-
-
-
-
-
-
-
-
-
-
-


