Root Cause Analysis Google Slides & PowerPoint Template

Product Description
Root Cause Analysis Template
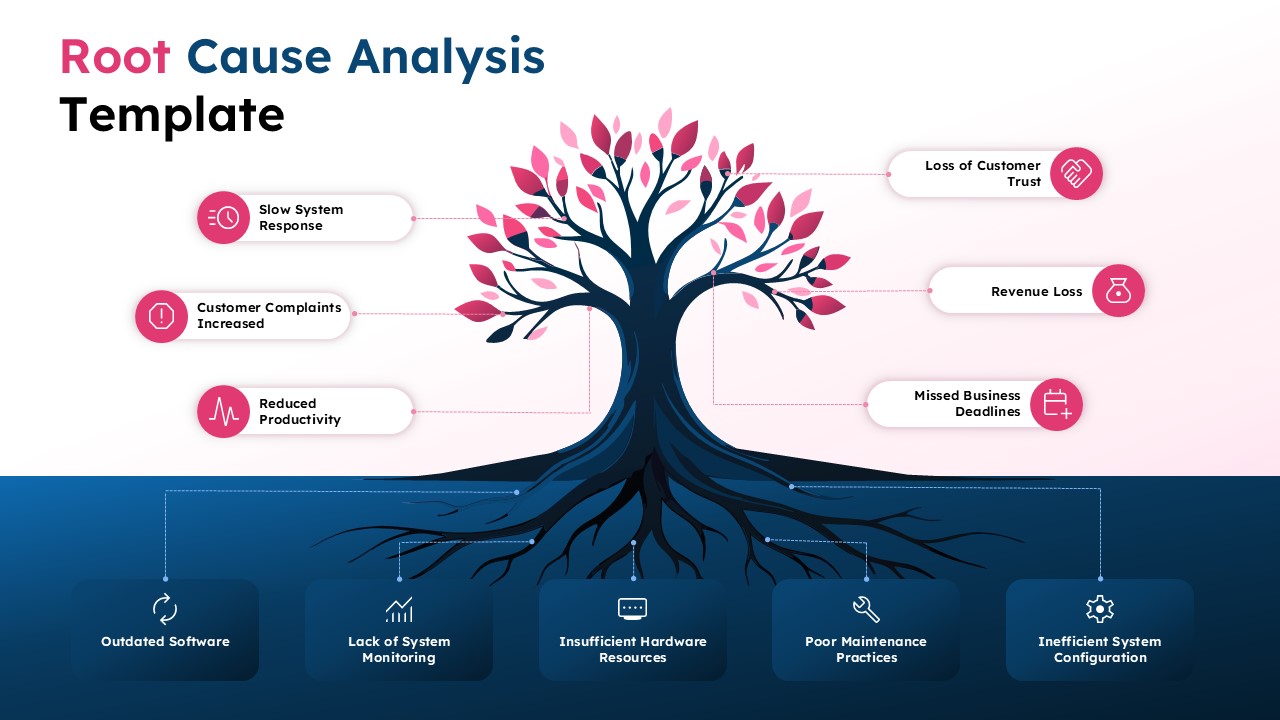
This Root Cause Analysis template features a striking tree diagram design that transforms complex problem-solving into an intuitive visual experience. The template uses a powerful nature metaphor where visible problems appear above ground while underlying causes are revealed in the root system below. Built for Microsoft PowerPoint and Google Slides, this completely editable template helps teams identify, analyze, and address systemic issues that impact business performance. The clean layout and professional color scheme make it perfect for presenting findings to stakeholders at any organizational level.
What’s Inside the Root Cause Analysis Template
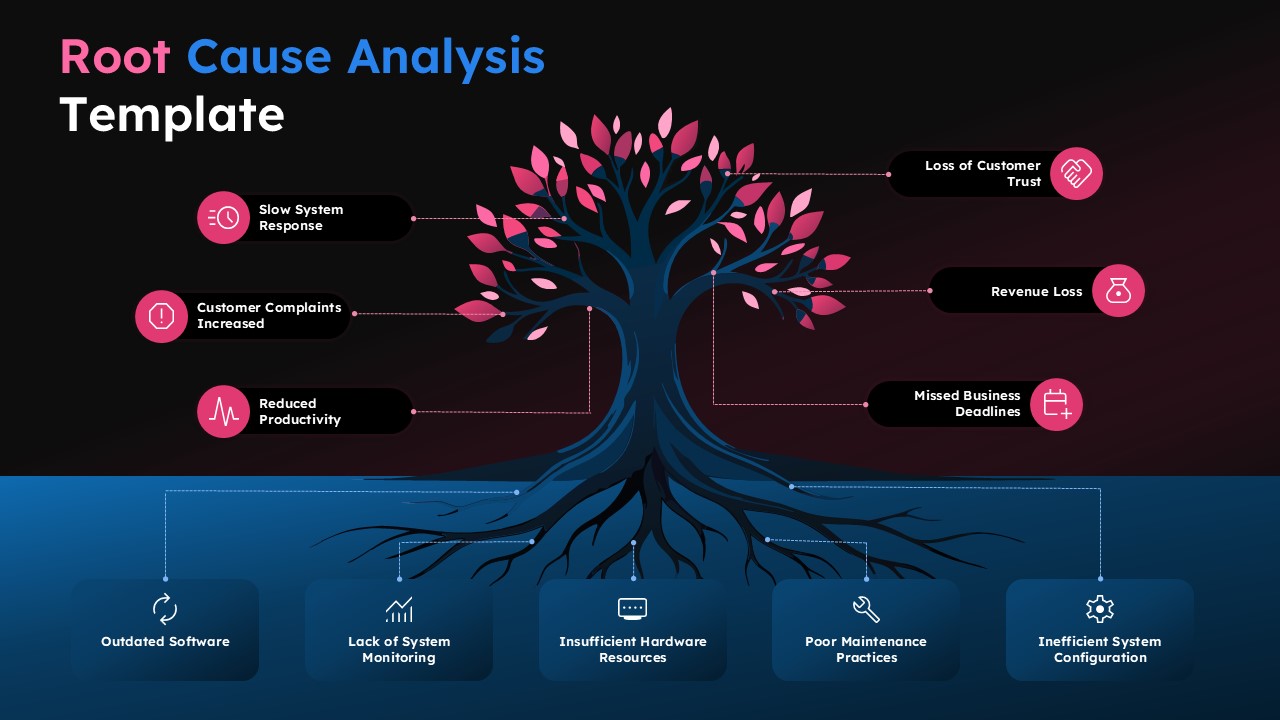
The template includes two professionally designed slides featuring an identical tree diagram structure with distinct visual sections. The upper portion displays problem symptoms and business impacts through pink circular icons connected to the tree crown, while the underground section reveals root causes through a detailed blue root system. Each slide incorporates placeholder text for systematic problem analysis, customizable color elements, and scalable icons that maintain clarity across different presentation formats. The design seamlessly blends analytical rigor with visual appeal through its modern gradient backgrounds and intuitive flow.
Key Features of Root Cause Analysis Template
- Tree metaphor design with above-ground problems and underground root causes
- Circular icon placeholders for symptoms, impacts, and underlying causes
- Professional pink and navy blue color scheme with gradient backgrounds
- Fully editable text, colors, and visual elements
- 16:9 aspect ratio optimized for modern displays
- Compatible with both PowerPoint and Google Slides
- Scalable design elements that maintain quality at any size
- Intuitive layout supporting systematic problem analysis
Ideal For
This template serves quality managers, project leaders, business analysts, and consultants who need to facilitate problem-solving sessions and present analytical findings. It’s particularly valuable for teams presenting business strategy presentations conducting process improvement initiatives, IT professionals troubleshooting system issues, and operations managers addressing performance challenges. The visual approach makes complex cause-and-effect relationships accessible to diverse audiences, from technical teams to executive stakeholders who require clear understanding of both surface problems and fundamental solutions.
Slide Highlights
The slides feature a sophisticated visual hierarchy with clean white backgrounds transitioning to deep blue underground sections. Pink circular icons with relevant symbols mark problem symptoms and business impacts, while the blue root system area houses underlying causes in a network of interconnected elements. The tree design incorporates detailed crown foliage and root structures that create natural connection points for cause and effect relationships. Typography remains highly readable across all sections, and the gradient elements add depth without compromising professional appearance.
Compatibility & Formats
This Root Cause Analysis template works seamlessly with Microsoft PowerPoint and Google Slides, ensuring broad accessibility across teams and organizations. All design elements, text placeholders, colors, and icons are fully editable, allowing complete customization to match specific analytical needs and brand requirements while maintaining the template’s proven visual effectiveness.
Frequently Asked Questions
How do I customize the problem categories in the Root Cause Analysis template?
All text placeholders in the template are fully editable. Simply click on any circular icon or text area to replace the default content with your specific problems, symptoms, impacts, and root causes. You can also change colors and add or remove elements as needed.
Can I use this template for different types of problem analysis beyond business issues?
Absolutely! While the examples show business scenarios, the tree diagram structure works for any cause-and-effect analysis including technical troubleshooting, quality issues, process problems, or system failures across various industries and applications.
Is the template suitable for team workshops and collaborative sessions?
Yes, the visual tree metaphor and clear section divisions make it excellent for facilitating group discussions. Teams can easily understand the structure and contribute ideas for each category, making it ideal for brainstorming sessions and collaborative problem-solving meetings.
Login to download this file
What do you think of this template?
Category:
Diagrams
Aspect Ratio: 16:9
Item ID: SPT0606
Color
Related Templates
-
-
-
Jigsaw Puzzle Google Slides & PowerPoint Template
Infographics
-
STEEPLE Analysis Framework Infographic for PowerPoint & Google Slides
Business Strategy
-
Market Gap Analysis Presentation Template for PowerPoint & Google Slides
Business Strategy
-
-
-
Organization Challenges Hub Diagram PowerPoint & Google Slides Template
Business Strategy
-
Pareto 80/20 Rule Chart PowerPoint & Google Slides Template
Charts & Graphs
-
-
-


