Sprint Burndown Chart for Google Slides & PowerPoint
Product Description
Sprint Burndown Chart
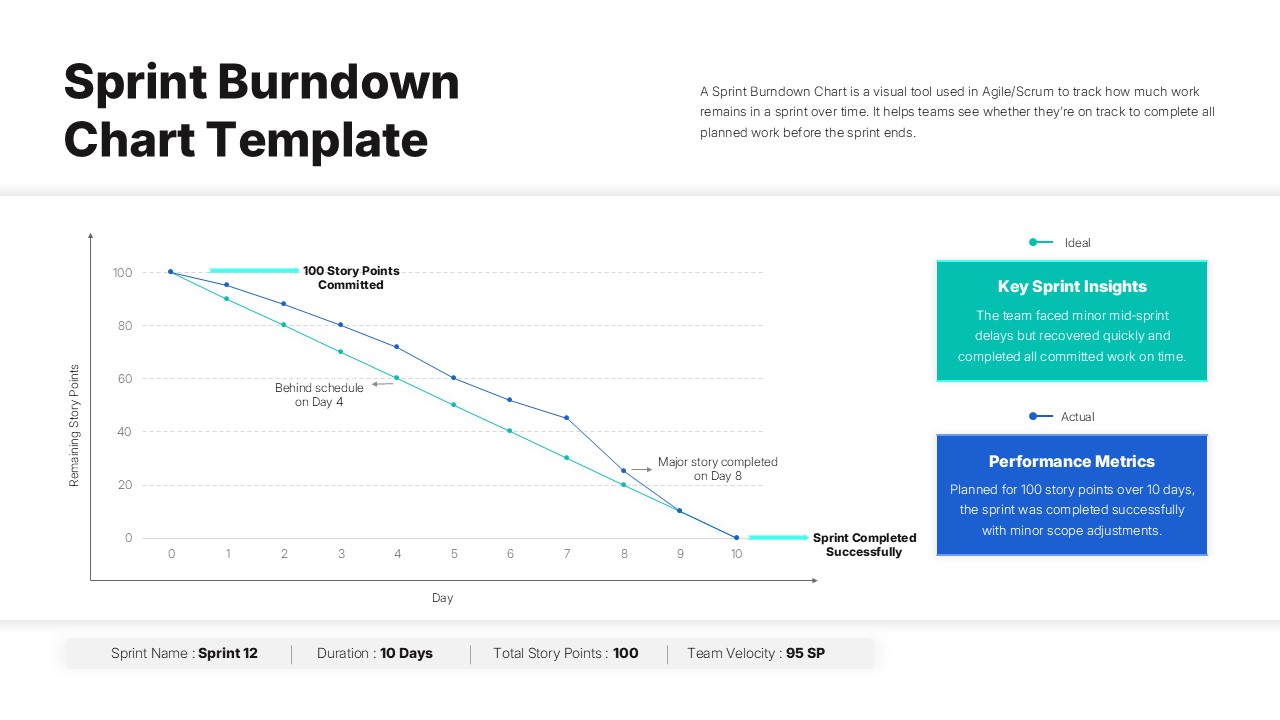
This professional sprint burndown chart template delivers a comprehensive visual framework for tracking Agile project progress with precision and clarity. The template features dual-axis line graphs that effectively display ideal versus actual story point completion rates throughout your sprint duration. Completely editable in both Microsoft PowerPoint and Google Slides, this template transforms complex sprint data into compelling visual narratives that resonate with stakeholders at every level. The sophisticated design balances detailed analytics with intuitive presentation flow, making sprint reviews and retrospectives more engaging and actionable for development teams and project managers.
What’s Inside the Sprint Burndown Chart Template
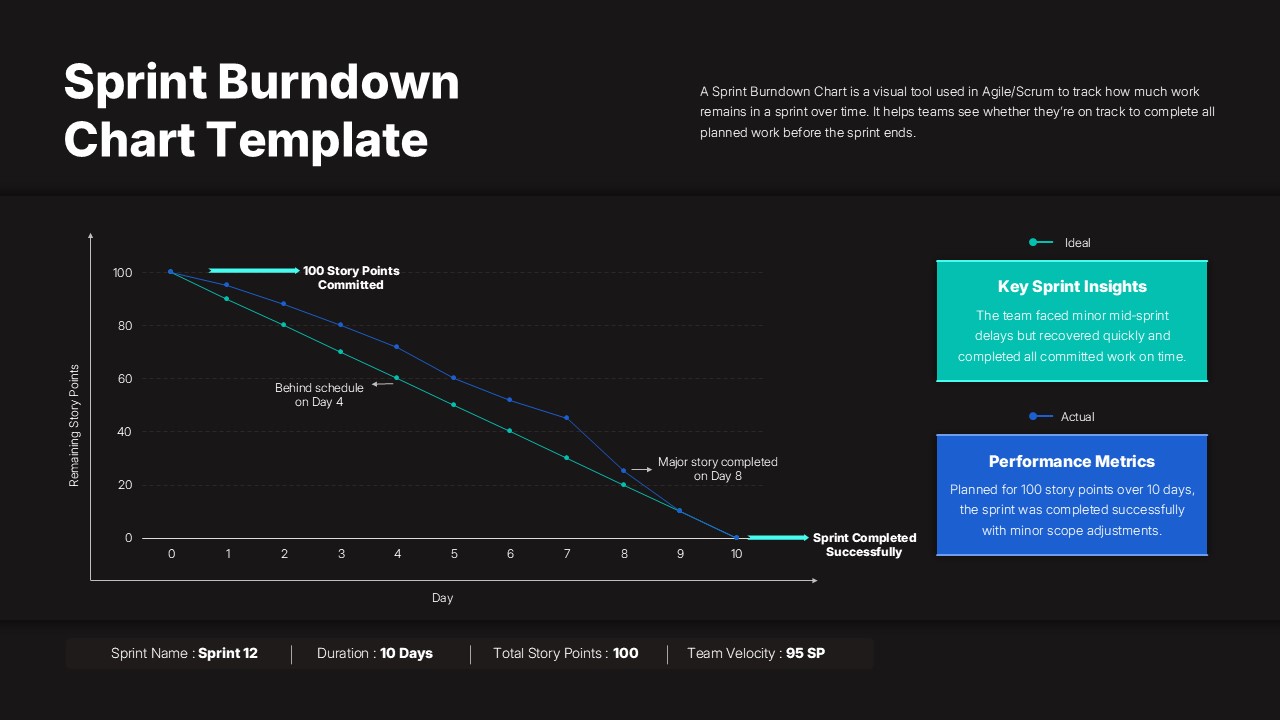
The template structure includes a prominent chart visualization occupying 60% of the slide real estate, complemented by two informational sidebar panels for qualitative insights and performance metrics. Key visual elements include customizable trend lines for ideal and actual burndown progression, annotated milestone markers, and a comprehensive footer displaying sprint name, duration, total story points, and team velocity. The color scheme utilizes professional teal and blue tones that maintain clarity across both light and dark theme variations, while text placeholders accommodate detailed sprint analysis and performance commentary.
Key Features of Sprint Burndown Chart Template
- Dual-axis line graph with customizable story point tracking and timeline visualization
- Professional sidebar panels for sprint insights and performance metrics display
- Annotated milestone markers highlighting critical sprint events and completions
- Comprehensive footer section with velocity, duration, and story point summaries
- Light and dark theme variations for different presentation environments
- Fully editable data points, colors, and text elements for sprint customization
- Clean layout design optimizing readability for both virtual and in-person meetings
- Professional color coding system for immediate trend recognition and analysis
Ideal For
This template serves Scrum Masters conducting sprint retrospectives, Product Owners presenting progress to stakeholders, and development teams analyzing velocity trends across multiple sprint cycles. Project management professionals will find it invaluable for executive reporting and strategic planning sessions. Agile coaches can leverage this template for training workshops and organizational transformation initiatives, while team leads use it to facilitate data-driven discussions about performance optimization and capacity planning.
Slide Highlights
The visual design showcases clean typography with high contrast ratios ensuring excellent readability across different display sizes and lighting conditions. The teal and blue color palette creates professional distinction between ideal and actual performance trends, while subtle grid lines and axis labels maintain chart precision without visual clutter. Strategic use of white space around chart elements prevents information overload, and the balanced sidebar layout provides contextual information without competing for attention with the primary data visualization. Icon integration and consistent spacing create a polished, executive-ready appearance that enhances credibility during Agile ceremonies and stakeholder communications.
Compatibility & Formats
Built for seamless compatibility with both Microsoft PowerPoint and Google Slides platforms, this template ensures consistent formatting and functionality across different operating systems and devices. All chart elements, text boxes, and design components remain fully editable, allowing teams to customize data ranges, color schemes, and content to match their specific sprint requirements and organizational branding standards.
Frequently Asked Questions
Can I customize the sprint duration and story point values in this burndown chart template?
Yes, all data points are fully customizable. You can adjust the sprint timeline from the default 10 days to match your team's sprint length, modify story point values, and update the trend lines to reflect your actual project data.
Does this template work for both PowerPoint and Google Slides?
Absolutely. The template is designed for full compatibility with both Microsoft PowerPoint and Google Slides, maintaining all formatting, colors, and functionality across both platforms without any loss in quality or features.
Are there different color themes available for this sprint burndown chart?
Yes, the template includes both light and dark theme variations. The light version features a clean white background, while the dark version uses a professional black background. Both maintain the same teal and blue color scheme for consistency.
Login to download this file
What do you think of this template?
Category:
Business
Aspect Ratio: 16:9
Item ID: SPT0514
Color
Related Templates
-
-
-
-
-
-
Project Risk Assessment Matrix PowerPoint & Google Slides Template
Project Management
-
-
-
-
-
AI Readiness Checklist Google Slides & PowerPoint Template
Business Strategy
-


