Stock Market Analysis Bull Bear Comparison PowerPoint & Google Slides Template


Product Description
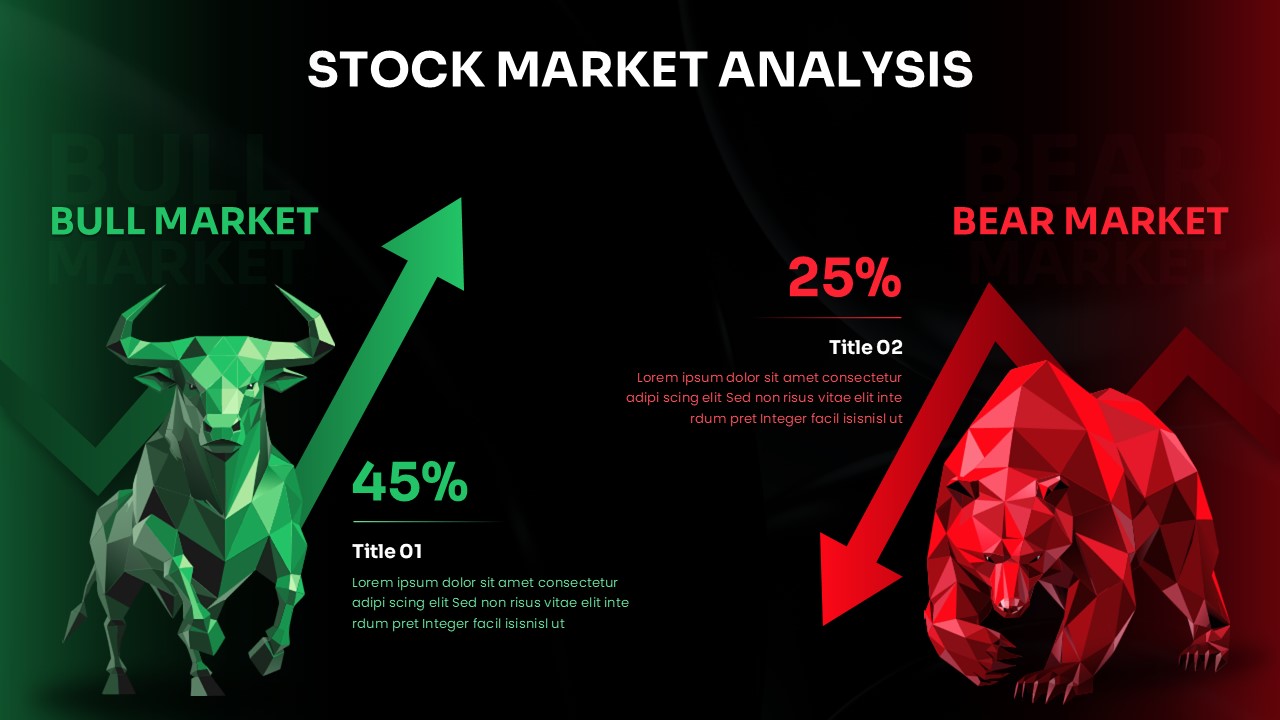
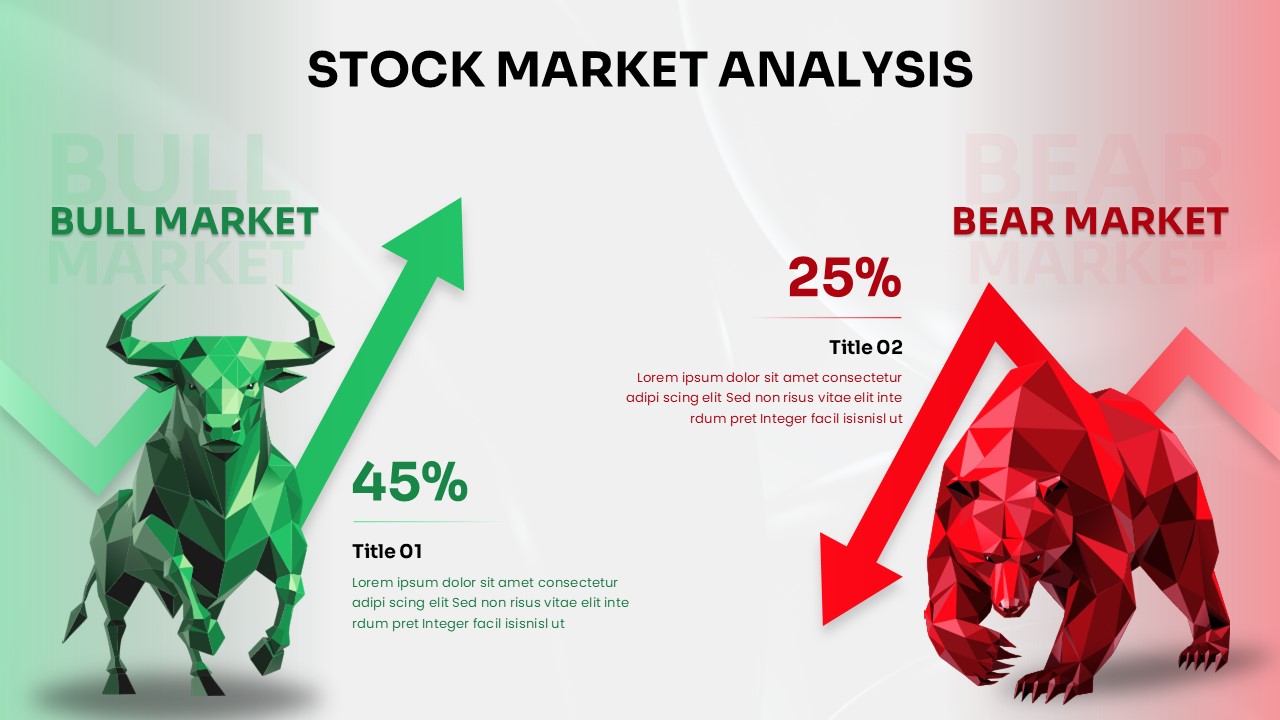
Stock Market Analysis Template
Transform your financial presentations with this professional Stock Market Analysis template featuring striking bull and bear market comparisons. This template combines geometric visual design with data-driven insights, perfect for presenting market trends, investment analysis, and financial performance metrics. The dramatic contrast between bullish and bearish market conditions helps audiences quickly understand market dynamics through both visual metaphors and statistical data.
What’s Inside the Stock Market Analysis Template
This comprehensive template includes 2 professionally designed slides in 16:9 aspect ratio. Each slide presents a split-screen layout comparing bull and bear market scenarios with statistical percentages, descriptive content areas, and geometric animal illustrations. The template offers two distinct background variations – a dramatic dark theme and a softer gradient background – providing flexibility for different presentation contexts while maintaining consistent visual hierarchy.
Key Features of Stock Market Analysis Template
- Split-screen comparison layout for clear market contrast
- Geometric low-poly bull and bear illustrations with directional arrows
- Two background variations: dark dramatic and light gradient themes
- Prominent percentage display areas for key financial metrics
- Professional color coding with green for bull markets and red for bear markets
- Fully editable text placeholders and data visualization elements
Ideal For
Financial analysts, investment advisors, portfolio managers, and business consultants will find this template invaluable for market reports, investor presentations, and client briefings. Perfect for quarterly reviews, market outlook presentations, investment strategy sessions, and educational seminars about stock market fundamentals. The template serves both corporate finance teams and independent financial professionals seeking to communicate complex market data effectively.
Slide Highlights
The template features symmetrical design elements with balanced visual weight, creating professional appeal suitable for boardroom presentations. Geometric animal illustrations provide memorable visual anchors while maintaining sophisticated aesthetics. The contrasting color scheme uses vibrant green gradients for bull market data and deep red gradients for bear market information, ensuring immediate visual comprehension of market conditions.
Compatibility & Formats
Fully compatible with both PowerPoint and Google Slides platforms, ensuring seamless editing across different software environments. All design elements, text formatting, and color schemes are preserved during platform transitions. The template supports standard presentation features including animation capabilities and custom formatting options.
Login to download this file
What do you think of this template?
Category:
Finance
Aspect Ratio: 16:9
Item ID: SPT0567
Color
Related Templates
-
-
-
-
-
-
-
STEEPLE Analysis Framework Infographic for PowerPoint & Google Slides
Business Strategy
-
-
-
-
-


