Thermometer Infographic PowerPoint & Google Slides Template


Product Description
Thermometer Infographic Template
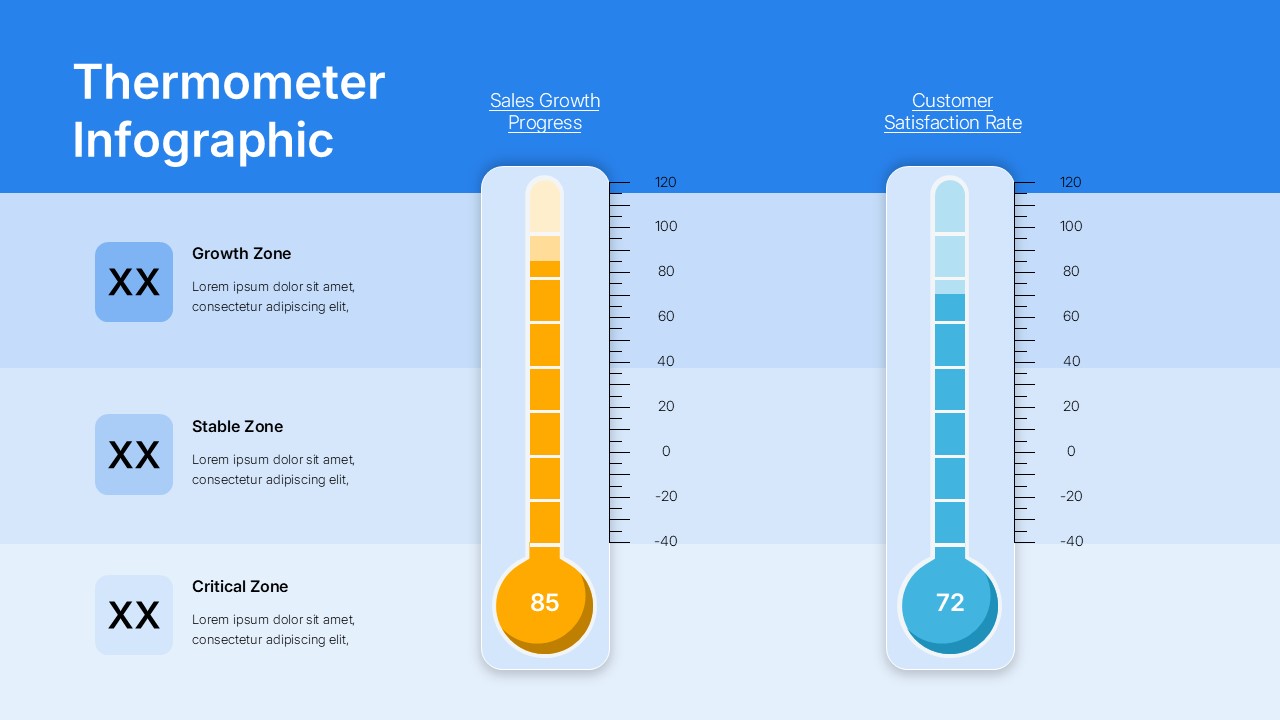
This thermometer infographic template transforms complex business data into clear visual narratives that audiences instantly understand. The template provides a fully editable presentation framework specifically designed for PowerPoint and Google Slides compatibility. Professional teams can leverage dual thermometer gauges to showcase comparative metrics while maintaining visual consistency across corporate presentations. The three-zone categorization system helps contextualize performance data within strategic business frameworks.
The template excels at converting numerical data points into compelling visual stories. Whether tracking quarterly sales figures or customer satisfaction benchmarks, the thermometer metaphor creates immediate recognition of performance temperature checks across different business areas.
What’s Inside the Thermometer Infographic Template
Two complementary slide designs feature identical structural layouts with contrasting visual themes. Each slide presents dual thermometer visualizations positioned centrally, with customizable numerical scales ranging from negative to positive values. The left sidebar contains three distinct categorical zones with dedicated icon placeholders and expandable text areas. Header sections accommodate main titles while individual thermometer labels provide specific metric identification. The layout maintains balanced proportions between data visualization elements and supporting categorical information.
Key Features of Thermometer Infographic Template
- Dual thermometer gauges for comparative metric analysis
- Three-zone categorization system with Growth, Stable, and Critical indicators
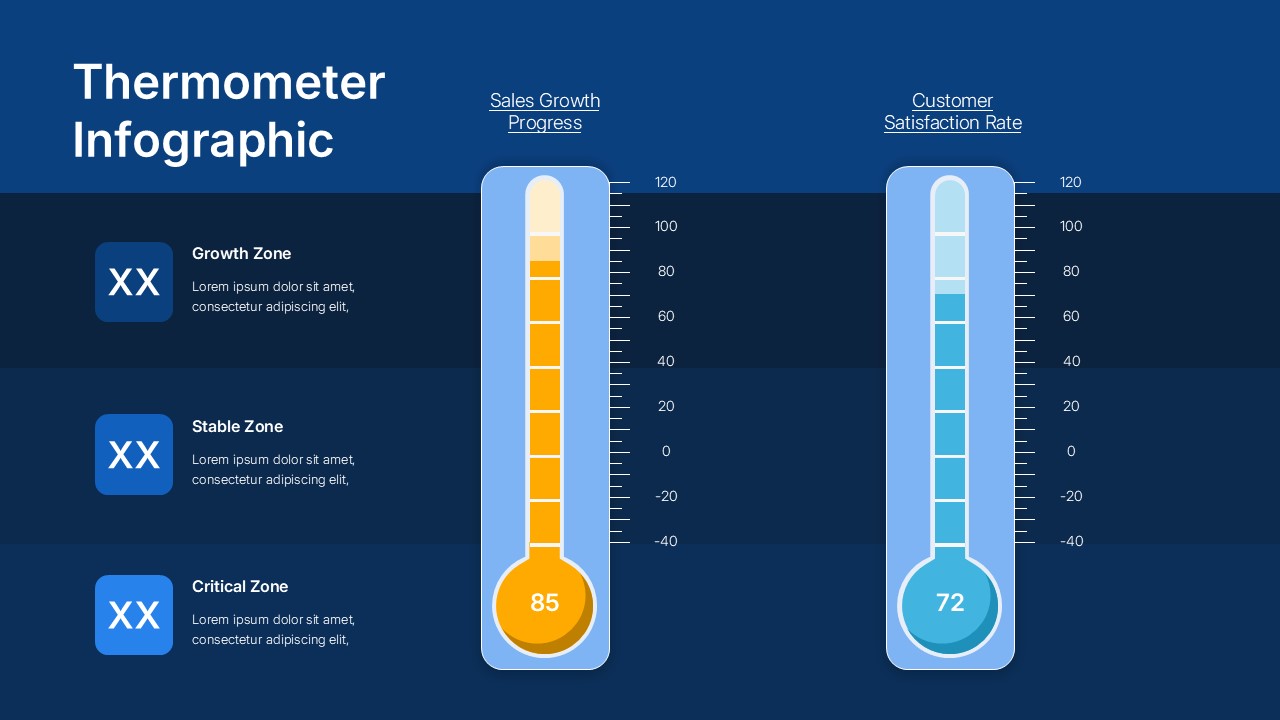
- Light and dark theme variants for versatile presentation contexts
- Fully customizable numerical ranges and measurement scales
- Icon placeholder integration for enhanced categorical representation
- Professional color coding that maintains accessibility standards
- Scalable vector elements that preserve quality at any resolution
Ideal For
Business analysts and executives will find tremendous value when presenting quarterly performance reviews or stakeholder briefings. Sales managers can effectively communicate progress toward revenue targets while customer success teams demonstrate satisfaction metrics to leadership. The template serves project managers tracking milestone achievements and department heads reporting operational efficiency measures. Marketing professionals benefit when showcasing campaign effectiveness while quality assurance teams can present service level performance data during business presentations.
Slide Highlights
The clean visual hierarchy guides viewer attention naturally from overview categories to specific performance metrics. Thermometer imagery creates intuitive understanding of whether metrics indicate healthy, concerning, or critical business conditions. Color psychology reinforces data interpretation through warm tones for growth indicators and cool tones for stability measures. The balanced composition prevents visual overwhelm while ensuring all data points receive appropriate emphasis. Dark theme variants provide sophisticated alternatives for executive dashboards and formal corporate environments.
Compatibility & Formats
This template works seamlessly with PowerPoint and Google Slides platforms, ensuring broad accessibility across different organizational technology preferences. All elements support easy editing through standard presentation software tools, allowing quick customization of colors, text, and numerical values. The template maintains formatting integrity when shared between different systems or exported to various file formats.
Frequently Asked Questions
Can I customize the numerical ranges on the thermometer scales?
Yes, all numerical scales are fully editable. You can adjust the minimum and maximum values, increment intervals, and measurement units to match your specific metrics and data ranges.
How do I change the thermometer colors to match my brand?
The thermometer colors are easily customizable through the standard formatting tools in PowerPoint and Google Slides. Simply select the thermometer elements and apply your preferred brand colors while maintaining good contrast for readability.
What types of business metrics work best with this template?
This template is ideal for percentage-based metrics, progress indicators, satisfaction scores, growth rates, performance ratios, and any numerical data that benefits from visual temperature or level representation, such as sales targets, customer satisfaction, employee engagement, or quality scores.
Login to download this file
What do you think of this template?
Category:
Infographics
Aspect Ratio: 16:9
Item ID: SPT0554
Color
Related Templates
-
-
-
-
-
-
-
STEEPLE Analysis Framework Infographic for PowerPoint & Google Slides
Business Strategy
-
-
-
-
-


