Pie Chart Data Breakdown Template for PowerPoint & Google Slides


Product Description
Description
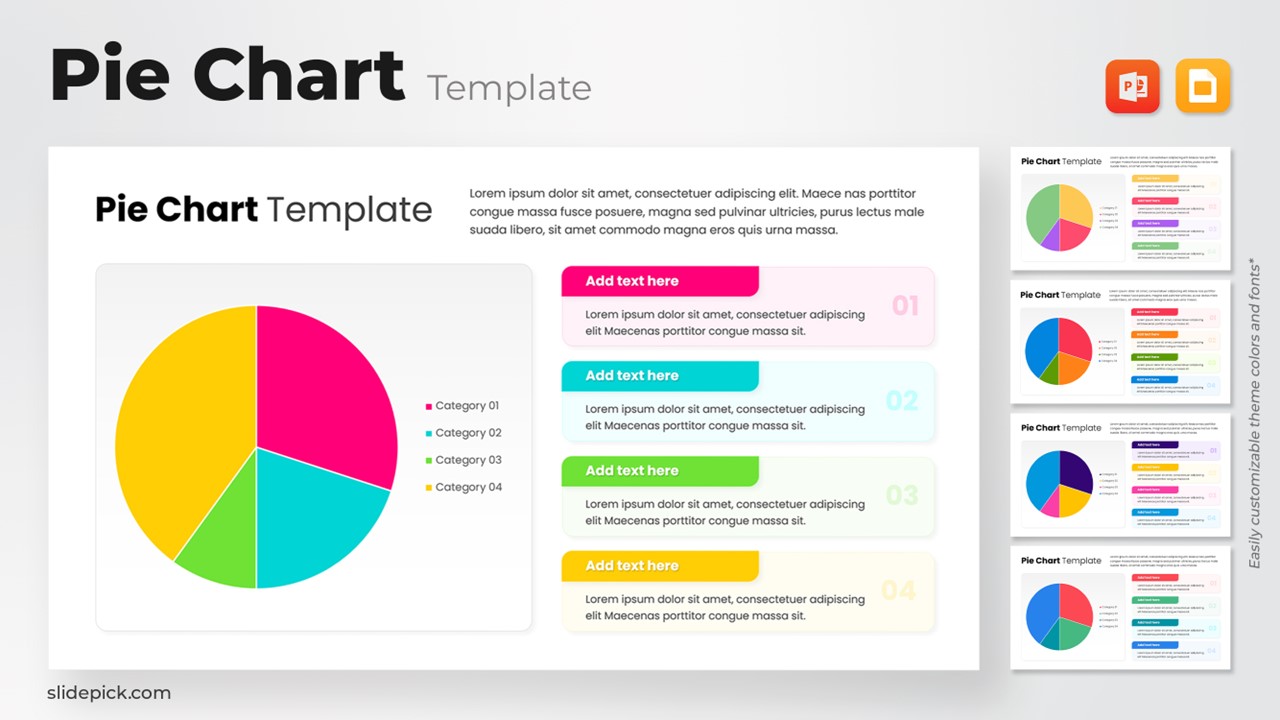
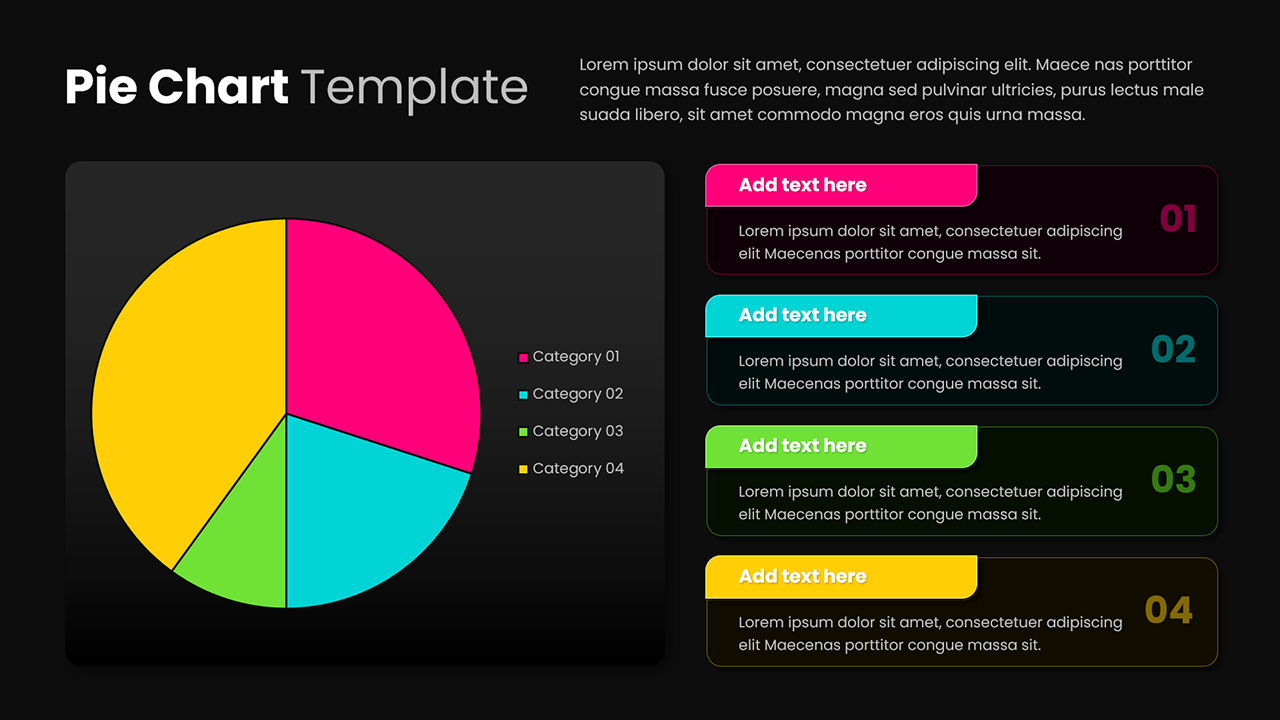
This pie chart presentation template offers a visually engaging way to display proportional data, category distribution, and segment comparisons in a clean, modern layout. Designed with bold contrasting colors and a balanced page structure, it allows presenters to communicate insights quickly and clearly. The left side features a large multi-segment pie chart, while the right side presents four numbered text panels for additional explanations or commentary. The result is an intuitive, audience-friendly data visualization slide suited for both professional and educational contexts.
What’s Inside the Template
The template includes a central pie chart divided into four distinct segments, each represented by a unique color. A matching legend appears alongside the chart to help viewers interpret categories at a glance. On the right side of the slide, four horizontal content blocks allow space for titles, descriptions, or data notes. Each block correspondingly uses the same color as its related chart segment, ensuring strong visual alignment. These components create a structured, digestible layout that helps transform raw data into clear storytelling.
Key Features
- Clean, modern design that emphasizes clarity and quick data interpretation
- Four color-coded sections with aligned numbering for easy connection between chart and explanations
- Spacious text areas for elaborating on insights or highlighting trends
- Balanced composition suitable for formal reporting, dashboards, client presentations, and instructional use
- Fully customizable colors, texts, and chart values to adapt to any industry or scenario
Ideal For
This template is ideal for analysts, marketers, educators, consultants, and business leaders who need to present category distribution or percentage-based metrics. It works especially well in report summaries, performance reviews, financial snapshots, user-segment breakdowns, and research overviews.
Slide Highlights
- A large multi-color pie chart that immediately captures attention
- Four structured text panels that support step-by-step explanation of data
- Color-coordinated labels that maintain visual consistency and guide the audience smoothly
- Soft rounded shapes and clean typography that contribute to a professional yet approachable style
Compatibility & Formats
This template is fully compatible with both PowerPoint and Google Slides. All elements—including shapes, text placeholders, and chart data—can be edited without additional software, giving users complete flexibility to adjust colors, values, or layouts to match their presentation needs.
Login to download this file
What do you think of this template?
Category:
Charts & Graphs
Aspect Ratio: 16:9
Item ID: SPT0040
Color
Related Templates
-
Pie Chart Data Breakdown Template for PowerPoint & Google Slides
Charts & Graphs
-
-
-
-
-
Pie Chart Presentation Template for PowerPoint & Google Slides
Charts & Graphs
-
Free Triple Pie Chart Infographic for PowerPoint & Google Slides
Charts & Graphs
-
-
-
-
-


