Year In Review Template for PowerPoint & Google Slides
Product Description
Year In Review Presentation Template
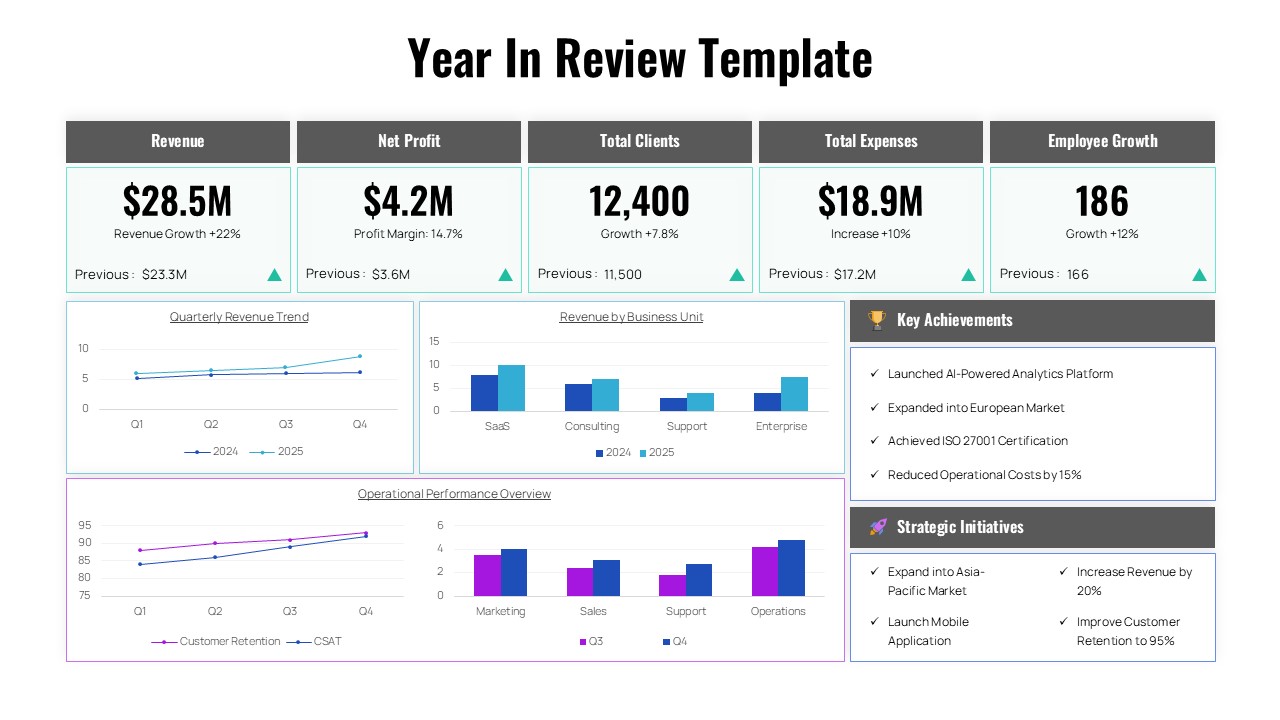
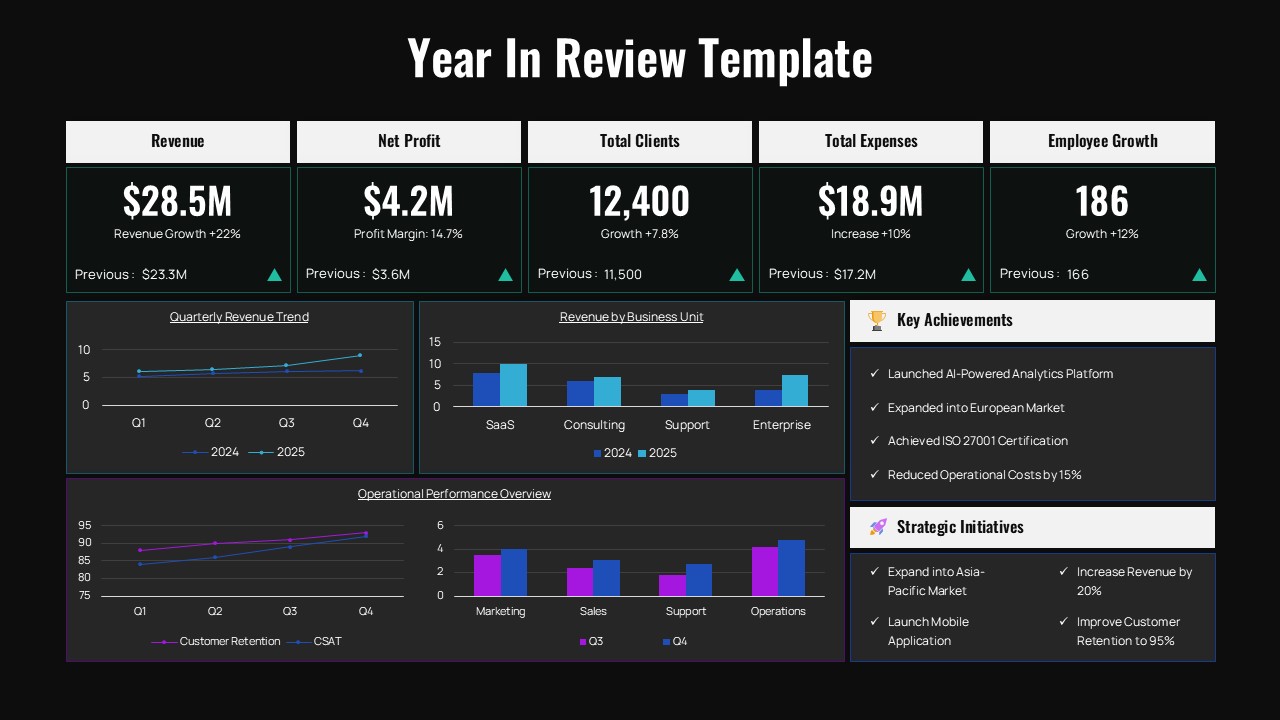
This comprehensive Year in Review template delivers a professional dashboard-style presentation that showcases your organization’s annual performance through compelling data visualizations and key metrics. The template features both light and dark theme variants, making it completely editable in Microsoft PowerPoint & Google Slides to match your brand preferences. Perfect for executive reporting, stakeholder communications, and annual business reviews, this template transforms complex business data into clear, actionable insights that demonstrate growth, achievements, and strategic direction.
What’s Inside the Year In Review Template
The template includes two professionally designed slides featuring a structured 5-column KPI header section displaying essential business metrics like revenue, net profit, client base, expenses, and employee growth. Below this, you’ll find comprehensive chart sections with quarterly revenue trends, business unit comparisons, and operational performance tracking. The layout incorporates modern data visualization elements including line charts, bar charts, and comparison graphs, all enhanced with teal accent colors and clean typography. Side panels provide space for key achievements and strategic initiatives, creating a complete business performance narrative.
Key Features of Year In Review Template
- Dual theme options with light and dark mode variations
- Comprehensive KPI dashboard with 5 key business metrics
- Multiple chart types including revenue trends and unit comparisons
- Professional color scheme with teal accents and modern gradients
- Structured sections for achievements and strategic initiatives
- Grid-based layout ensuring consistent visual hierarchy
- Fully customizable text placeholders and data visualization elements
- 16:9 aspect ratio optimized for modern presentation displays
Ideal For
This template serves executives, business leaders, and analysts who need to present comprehensive annual performance reviews to stakeholders, board members, or internal teams. It’s particularly valuable for companies conducting year-end assessments, strategic planning sessions, and investor presentations. The design works excellently for consulting professionals preparing client reports, HR departments showcasing organizational growth, and management teams communicating achievements and future initiatives to various audiences.
Slide Highlights
The slides feature a sophisticated light gray background with strategic use of teal and turquoise accent colors that draw attention to growth indicators and key data points. Clean, modern typography ensures excellent readability across all sections, while the dashboard-style layout creates an executive-level professional appearance. The dark theme variant maintains the same visual impact with high contrast white text against deep backgrounds. Charts and graphs utilize complementary blue and purple tones, creating a cohesive visual story that makes complex data analysis accessible and engaging for any audience.
Compatibility & Formats
This Year in Review template is fully compatible with both Microsoft PowerPoint and Google Slides, ensuring seamless editing and presentation capabilities across platforms. All elements including charts, text placeholders, colors, and graphics are completely customizable, allowing you to adapt the content to your specific business needs while maintaining the professional design integrity.
Frequently Asked Questions
Can I customize the KPI metrics shown in the dashboard?
Yes, all KPI metrics and values are fully editable. You can modify the revenue, profit, client numbers, expenses, and growth percentages to reflect your actual business data and add or remove metrics as needed.
Are both light and dark themes included in the template?
Absolutely! The template includes both light and dark theme variations, giving you flexibility to choose the version that best matches your brand guidelines or presentation environment.
Can I modify the charts and graphs with my own data?
Yes, all charts including the revenue trends, business unit comparisons, and operational performance graphs are completely customizable. You can input your own data and adjust the chart types, colors, and labels to match your specific reporting needs.
Login to download this file
What do you think of this template?
Category:
Business Reports
Aspect Ratio: 16:9
Item ID: SPT0584
Color
Related Templates
-
-
-
-
-
-
-
-
-
Modern Gantt Chart Project Timeline Template for PowerPoint & Google Slides
Project Management
-
-
-


