Free Triple Pie Chart Infographic for PowerPoint & Google Slides


Product Description
Description
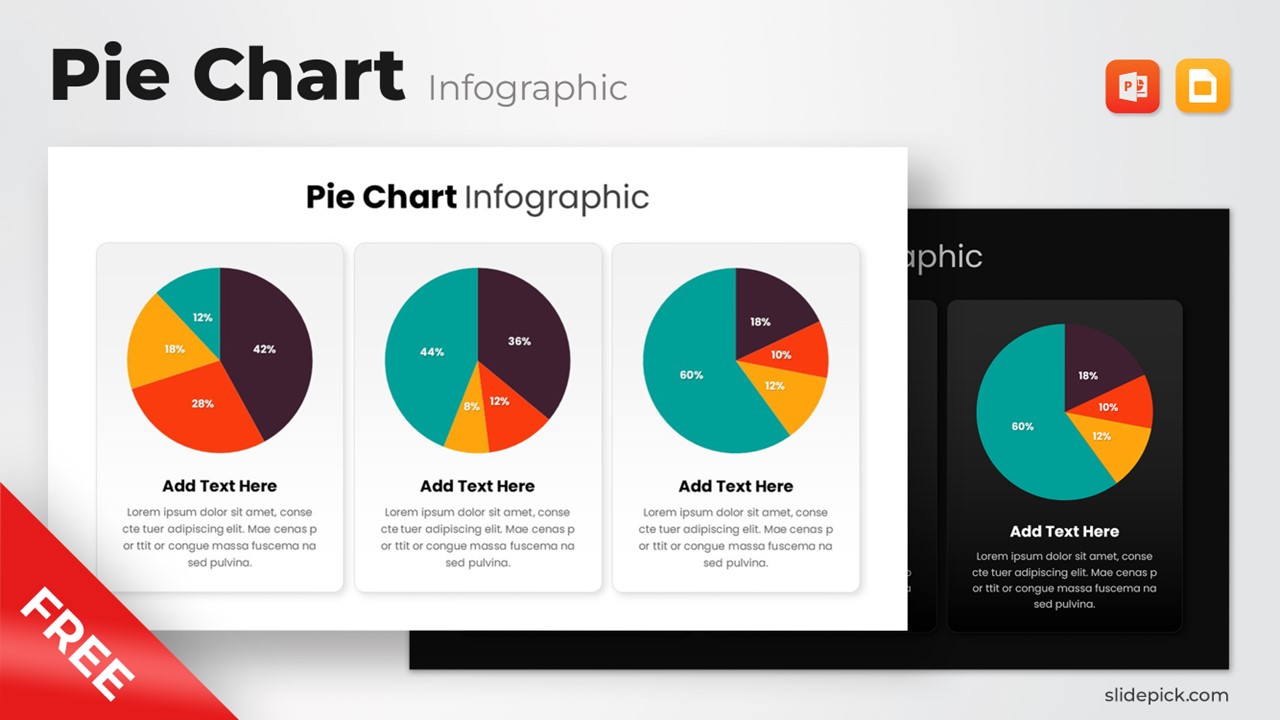
This free pie chart infographic template offers a clean, modern layout designed to help presenters communicate data-driven insights with clarity. Featuring three side-by-side pie chart panels, the template is ideal for breaking down complex metrics into digestible visuals. Its balanced spacing, rounded card-style containers, and bold color segmentation make it suitable for business reports, marketing dashboards, academic presentations, and departmental updates.
What’s Inside the Template
The template includes three fully editable pie chart slides, each placed within a soft, rounded frame to maintain consistent visual structure. Under every chart, a dedicated text block allows you to elaborate on data findings, add contextual commentary, or summarize performance highlights. Colors, percentages, and labels can be freely customized in both PowerPoint and Google Slides, giving you complete flexibility to match brand guidelines or presentation themes.
Key Features
- Three distinct pie chart layouts for comparative or standalone data views
- Editable percentage segments and color palettes
- Clean card-based design for enhanced readability
- Ample space for accompanying text descriptions
- Fully compatible with PowerPoint and Google Slides
- Ideal for showcasing distribution, proportions, and segmented results
Ideal For
This template serves professionals, educators, analysts, and marketers who need a clear and visually appealing method to present segmented data. It is especially useful for quarterly reports, customer breakdowns, budget allocations, performance summaries, or survey result presentations.
Slide Highlights
Each slide features:
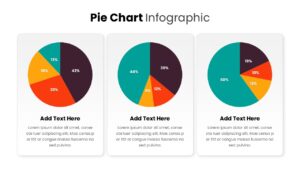
- A bold central pie chart with multi-color segmentation
- Visible percentage labels for fast comprehension
- A lower text section for explanations, recommendations, or insights
- A consistent layout across all three panels for seamless comparison
These structural elements help maintain viewer focus and ensure that your data narrative flows naturally.
Compatibility & Formats
This free template is available for PowerPoint (.pptx) and Google Slides, ensuring easy editing, sharing, and brand adaptation. All graphical elements are vector-based and can be resized without losing clarity.
Login to download this file
What do you think of this template?
Category:
Charts
Aspect Ratio: 16:9
Item ID: SPT0039
Color


